% Penetration | 0% | 25% | 50% | 75% | 100% |
|---|---|---|---|---|---|
Stunting | |||||
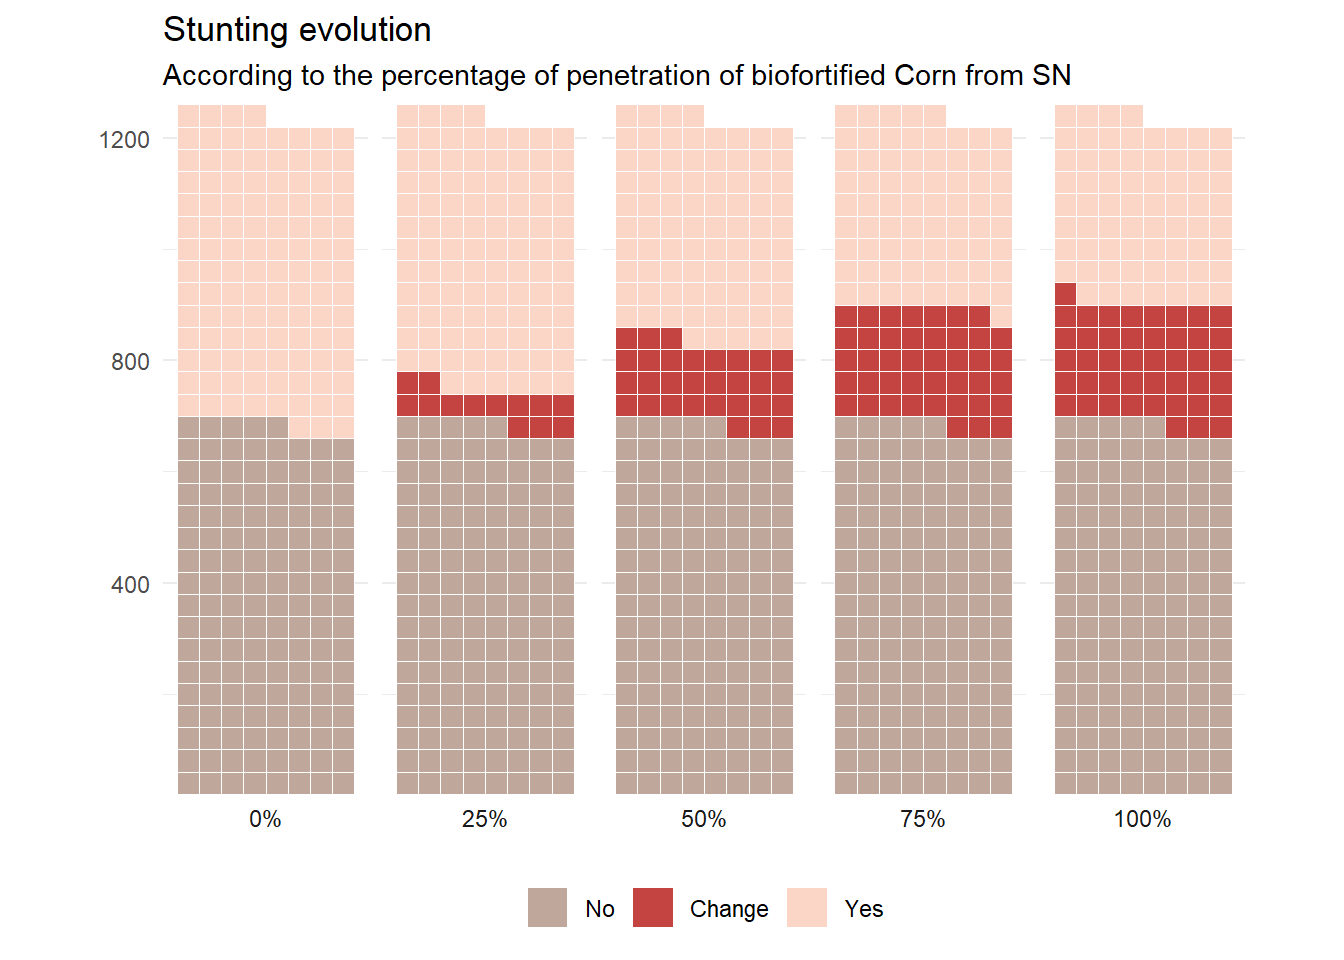
No | 667 (54.5%) | 719 (58.8%) | 781 (63.9%) | 828 (67.7%) | 873 (71.4%) |
Yes | 556 (45.5%) | 504 (41.2%) | 442 (36.1%) | 395 (32.3%) | 350 (28.6%) |
Results of the Penetration of Biofortified Corn from SN
Generation of results for different levels of penetration of SN biofortified corn consumption in chronic child malnutrition in children in Guatemala.
Summary Table of Child Malnutrition Percentages
Below is a comparison table of malnutrition percentages based on the penetration levels of SN biofortified corn.
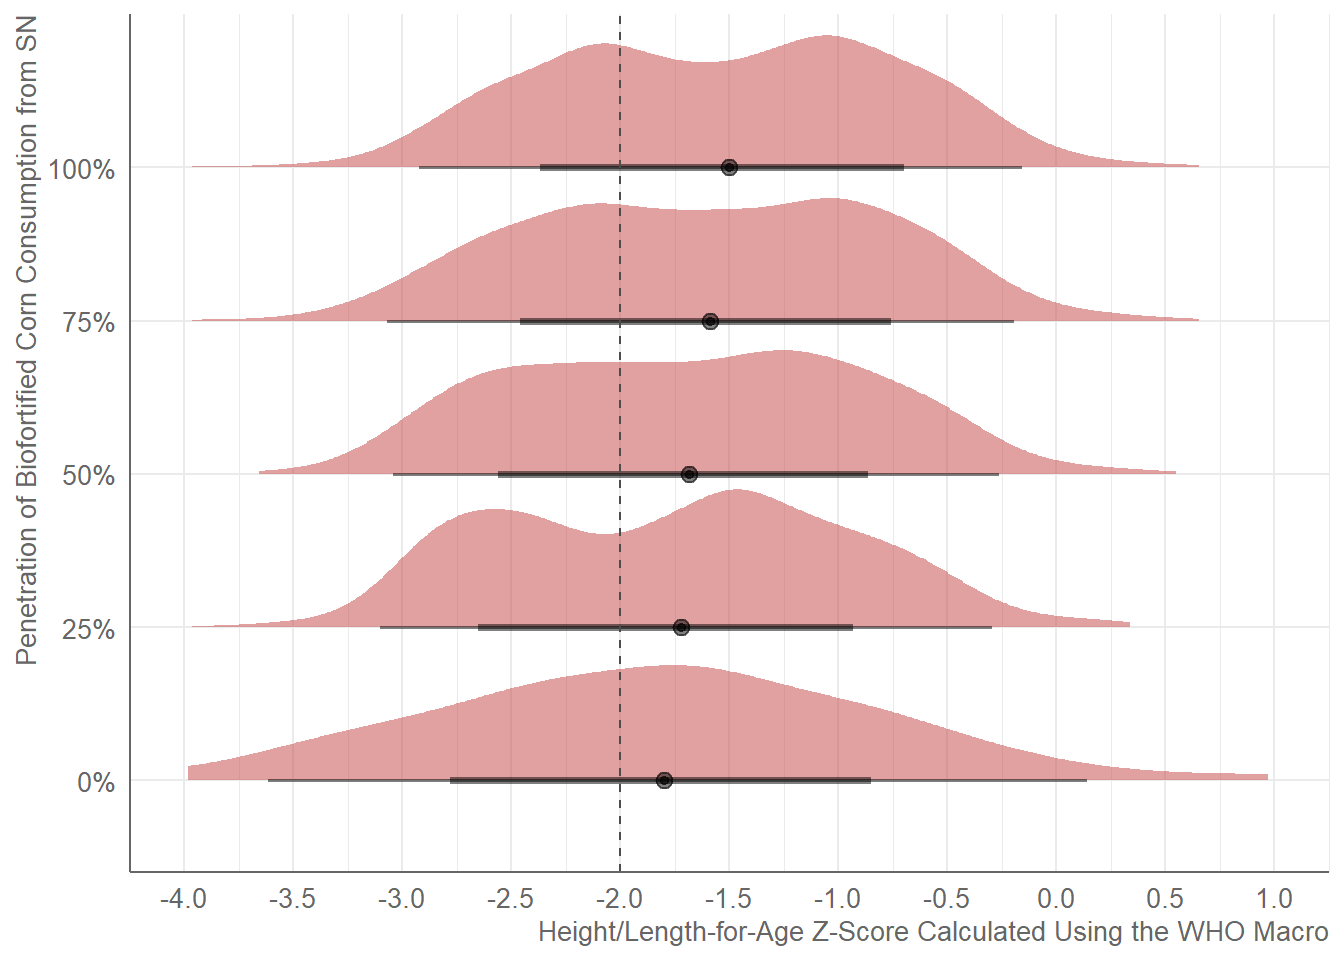
Additionally, a table is shown with the improvement in Z-scores of children according to the penetration of SN biofortified corn.
% Penetration | 0% | 25% | 50% | 75% | 100% |
|---|---|---|---|---|---|
Z-score length/age | |||||
Median | -1.90 | -1.78 | -1.74 | -1.65 | -1.56 |
[IQR] | [-2.61, -1.17] | [-2.50, -1.19] | [-2.39, -1.11] | [-2.25, -1.00] | [-2.18, -0.95] |
Ridge Plot with the Z-Scores Calculated According to WHO Parameters
Evolution Graph of Chronic Malnutrition