Variable Selection for the Stunting Model
Data Preparation for Chronic Malnutrition Models in Children.
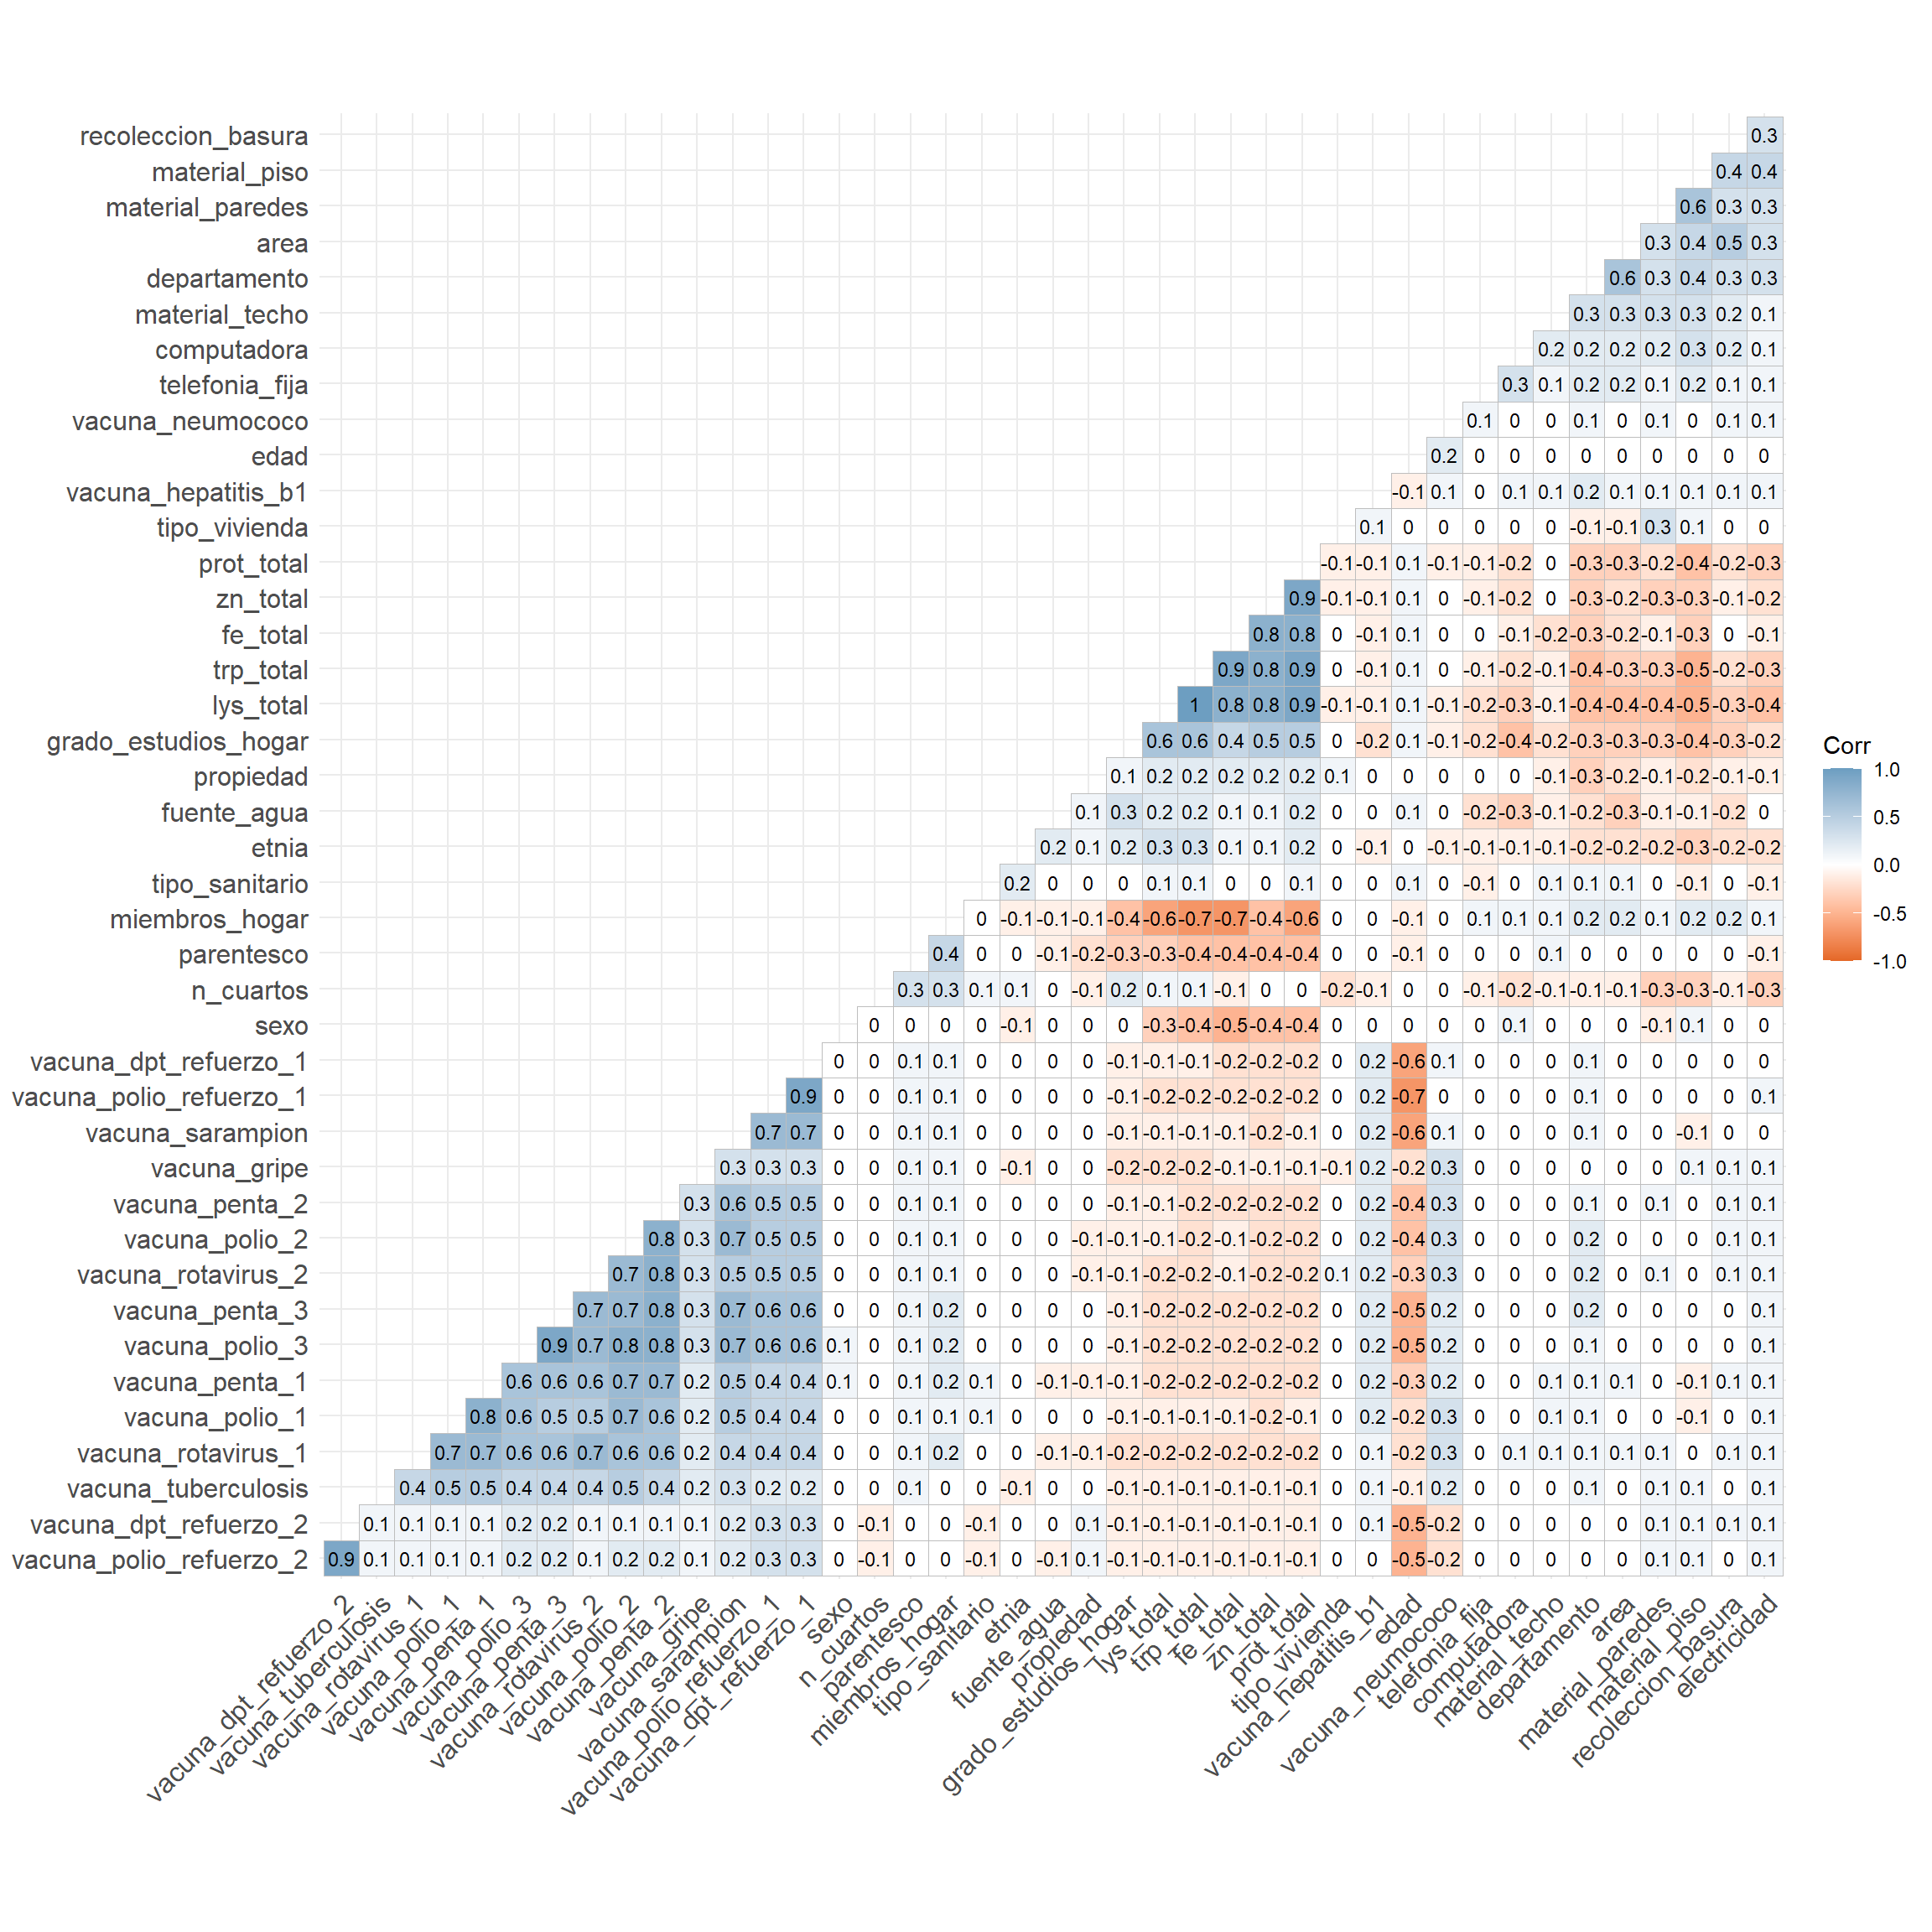
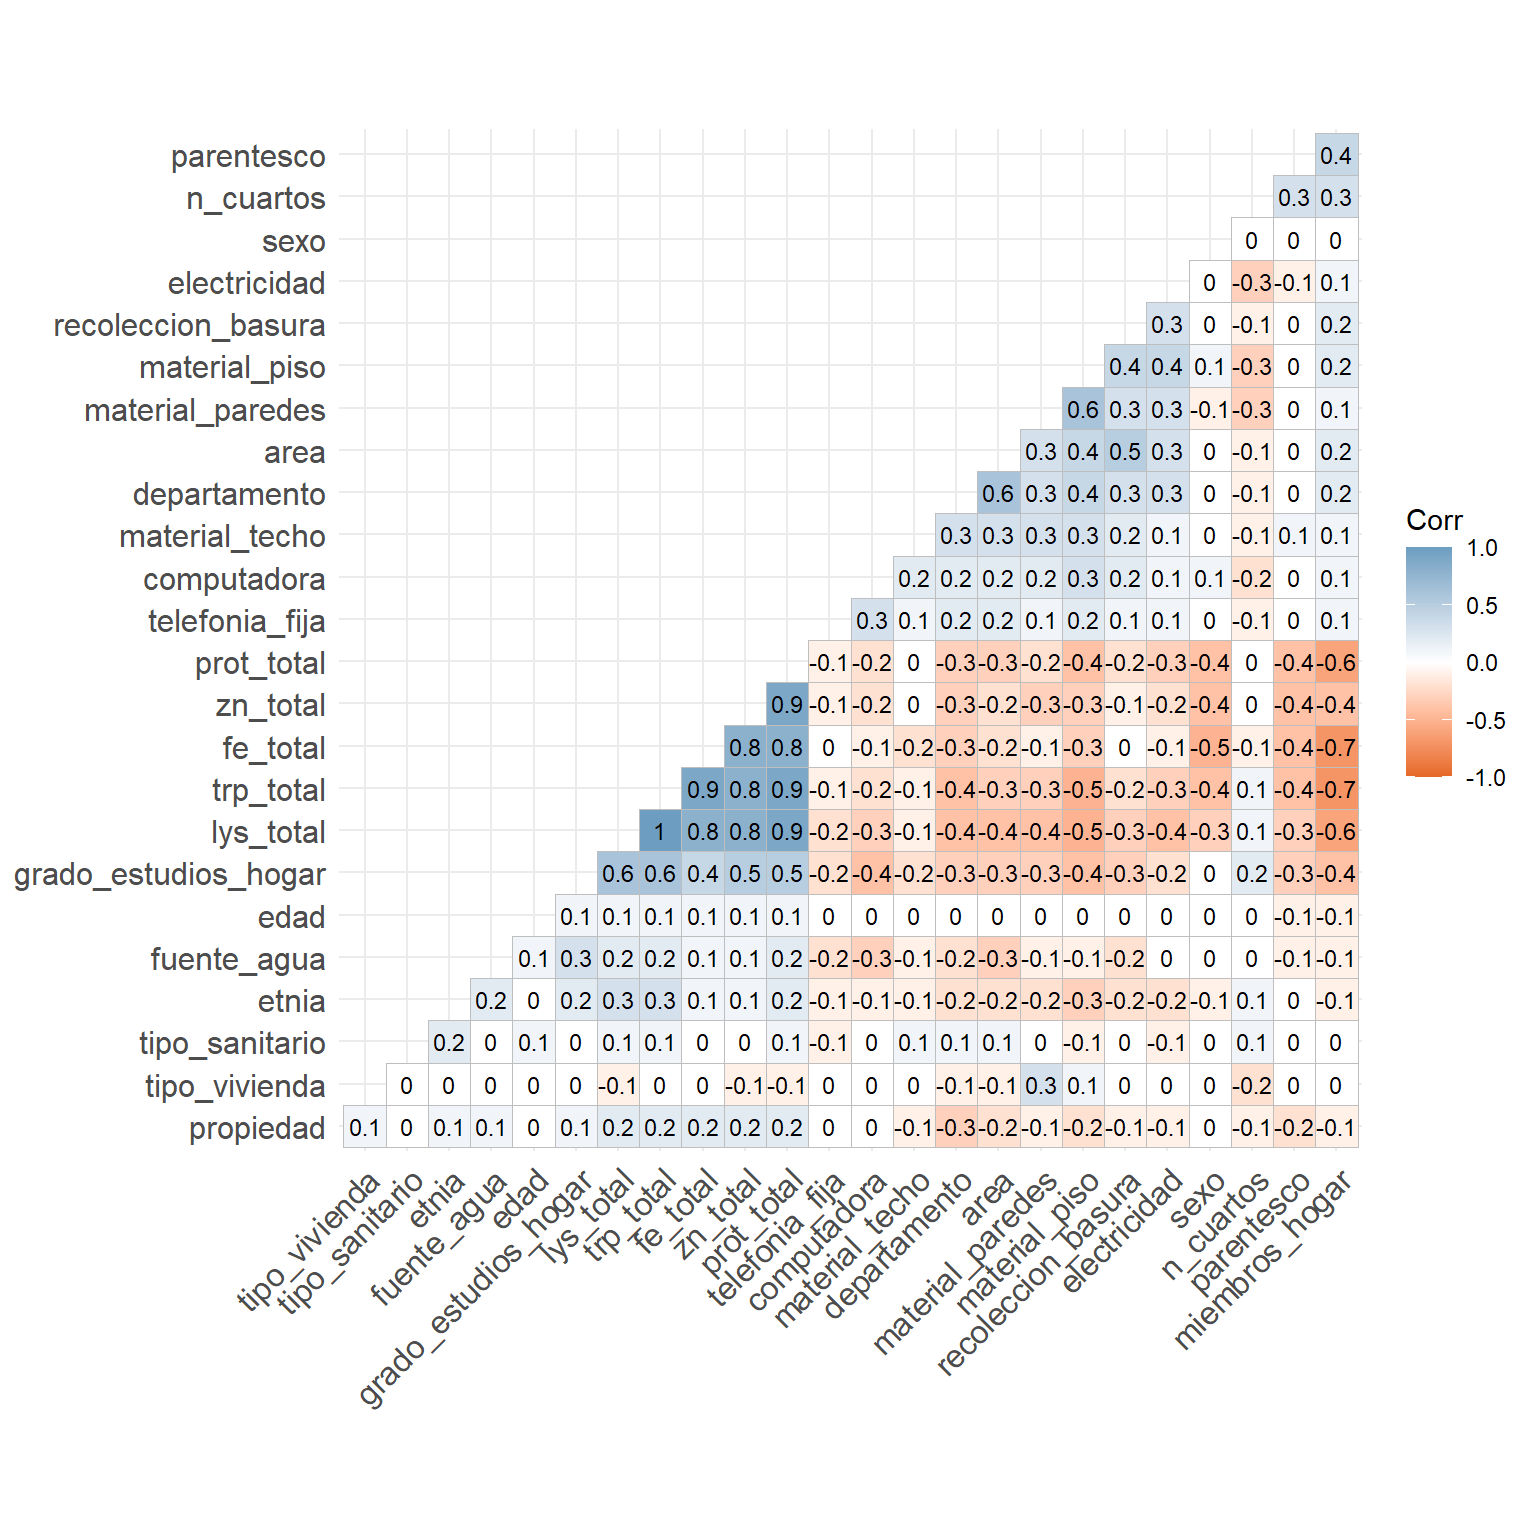
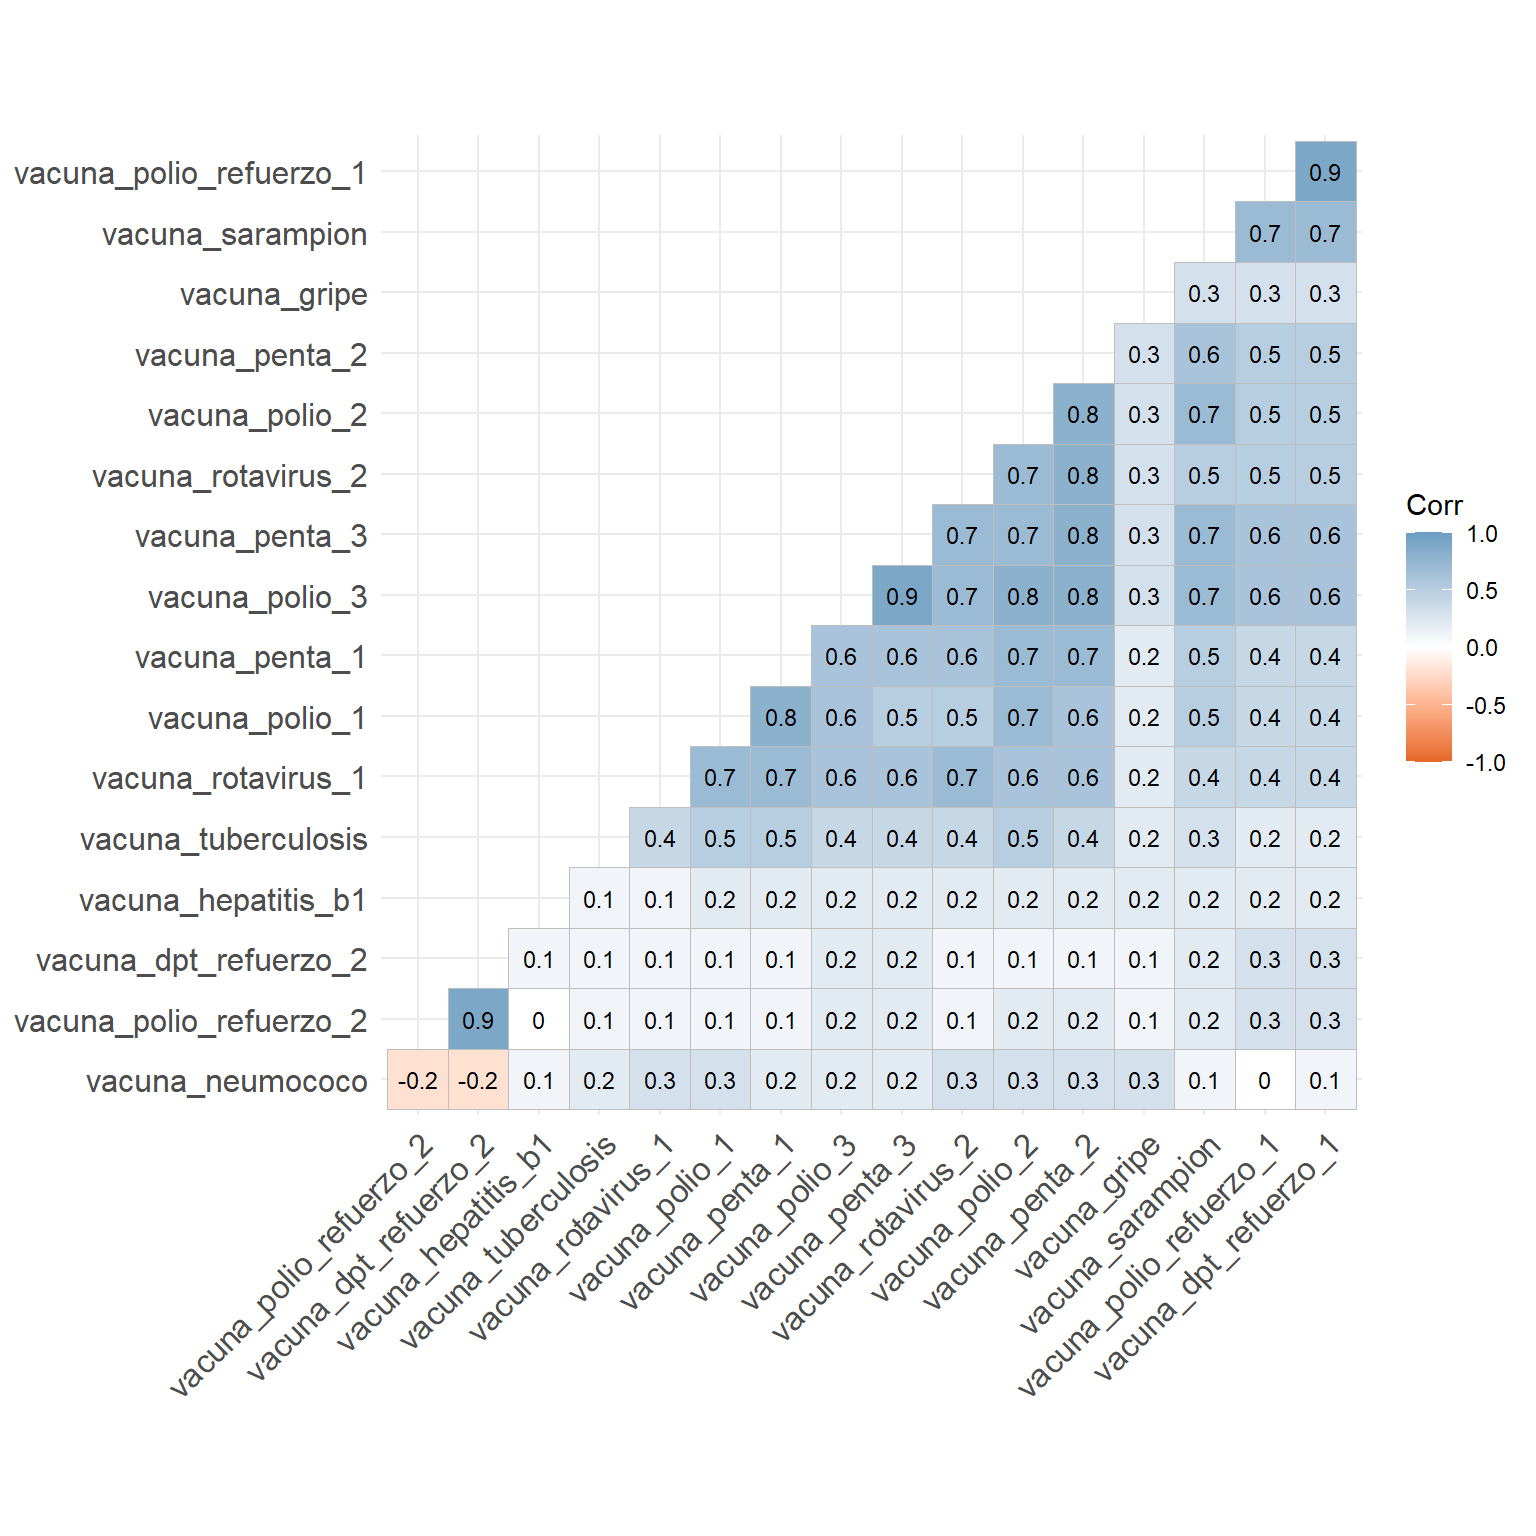
Evaluation of the correlation of the predictor variables
In this section, the correlation between predictor variables will be evaluated to identify potential issues of multicollinearity.
Based on the graph, we should analyze the nutritional variables with caution, as some of them exhibit very high correlations. Similarly, the immunological variables also show patterns of multicollinearity and should be studied individually.
Based on the results, to maximize the information provided to the model, it is decided to retain the two variables that show the least correlation with each other and with the others, namely, the variables associated with zinc and iron.
Regarding the immunological variables, it is decided to group the variables that show very high correlations among themselves to reduce multicollinearity. Thus, variables Refuerzo 1 and Refuerzo 2 are created to combine polio and DPT vaccines, respectively. Additionally, a numerical variable is created to aggregate the number of routine vaccines received by the individual.
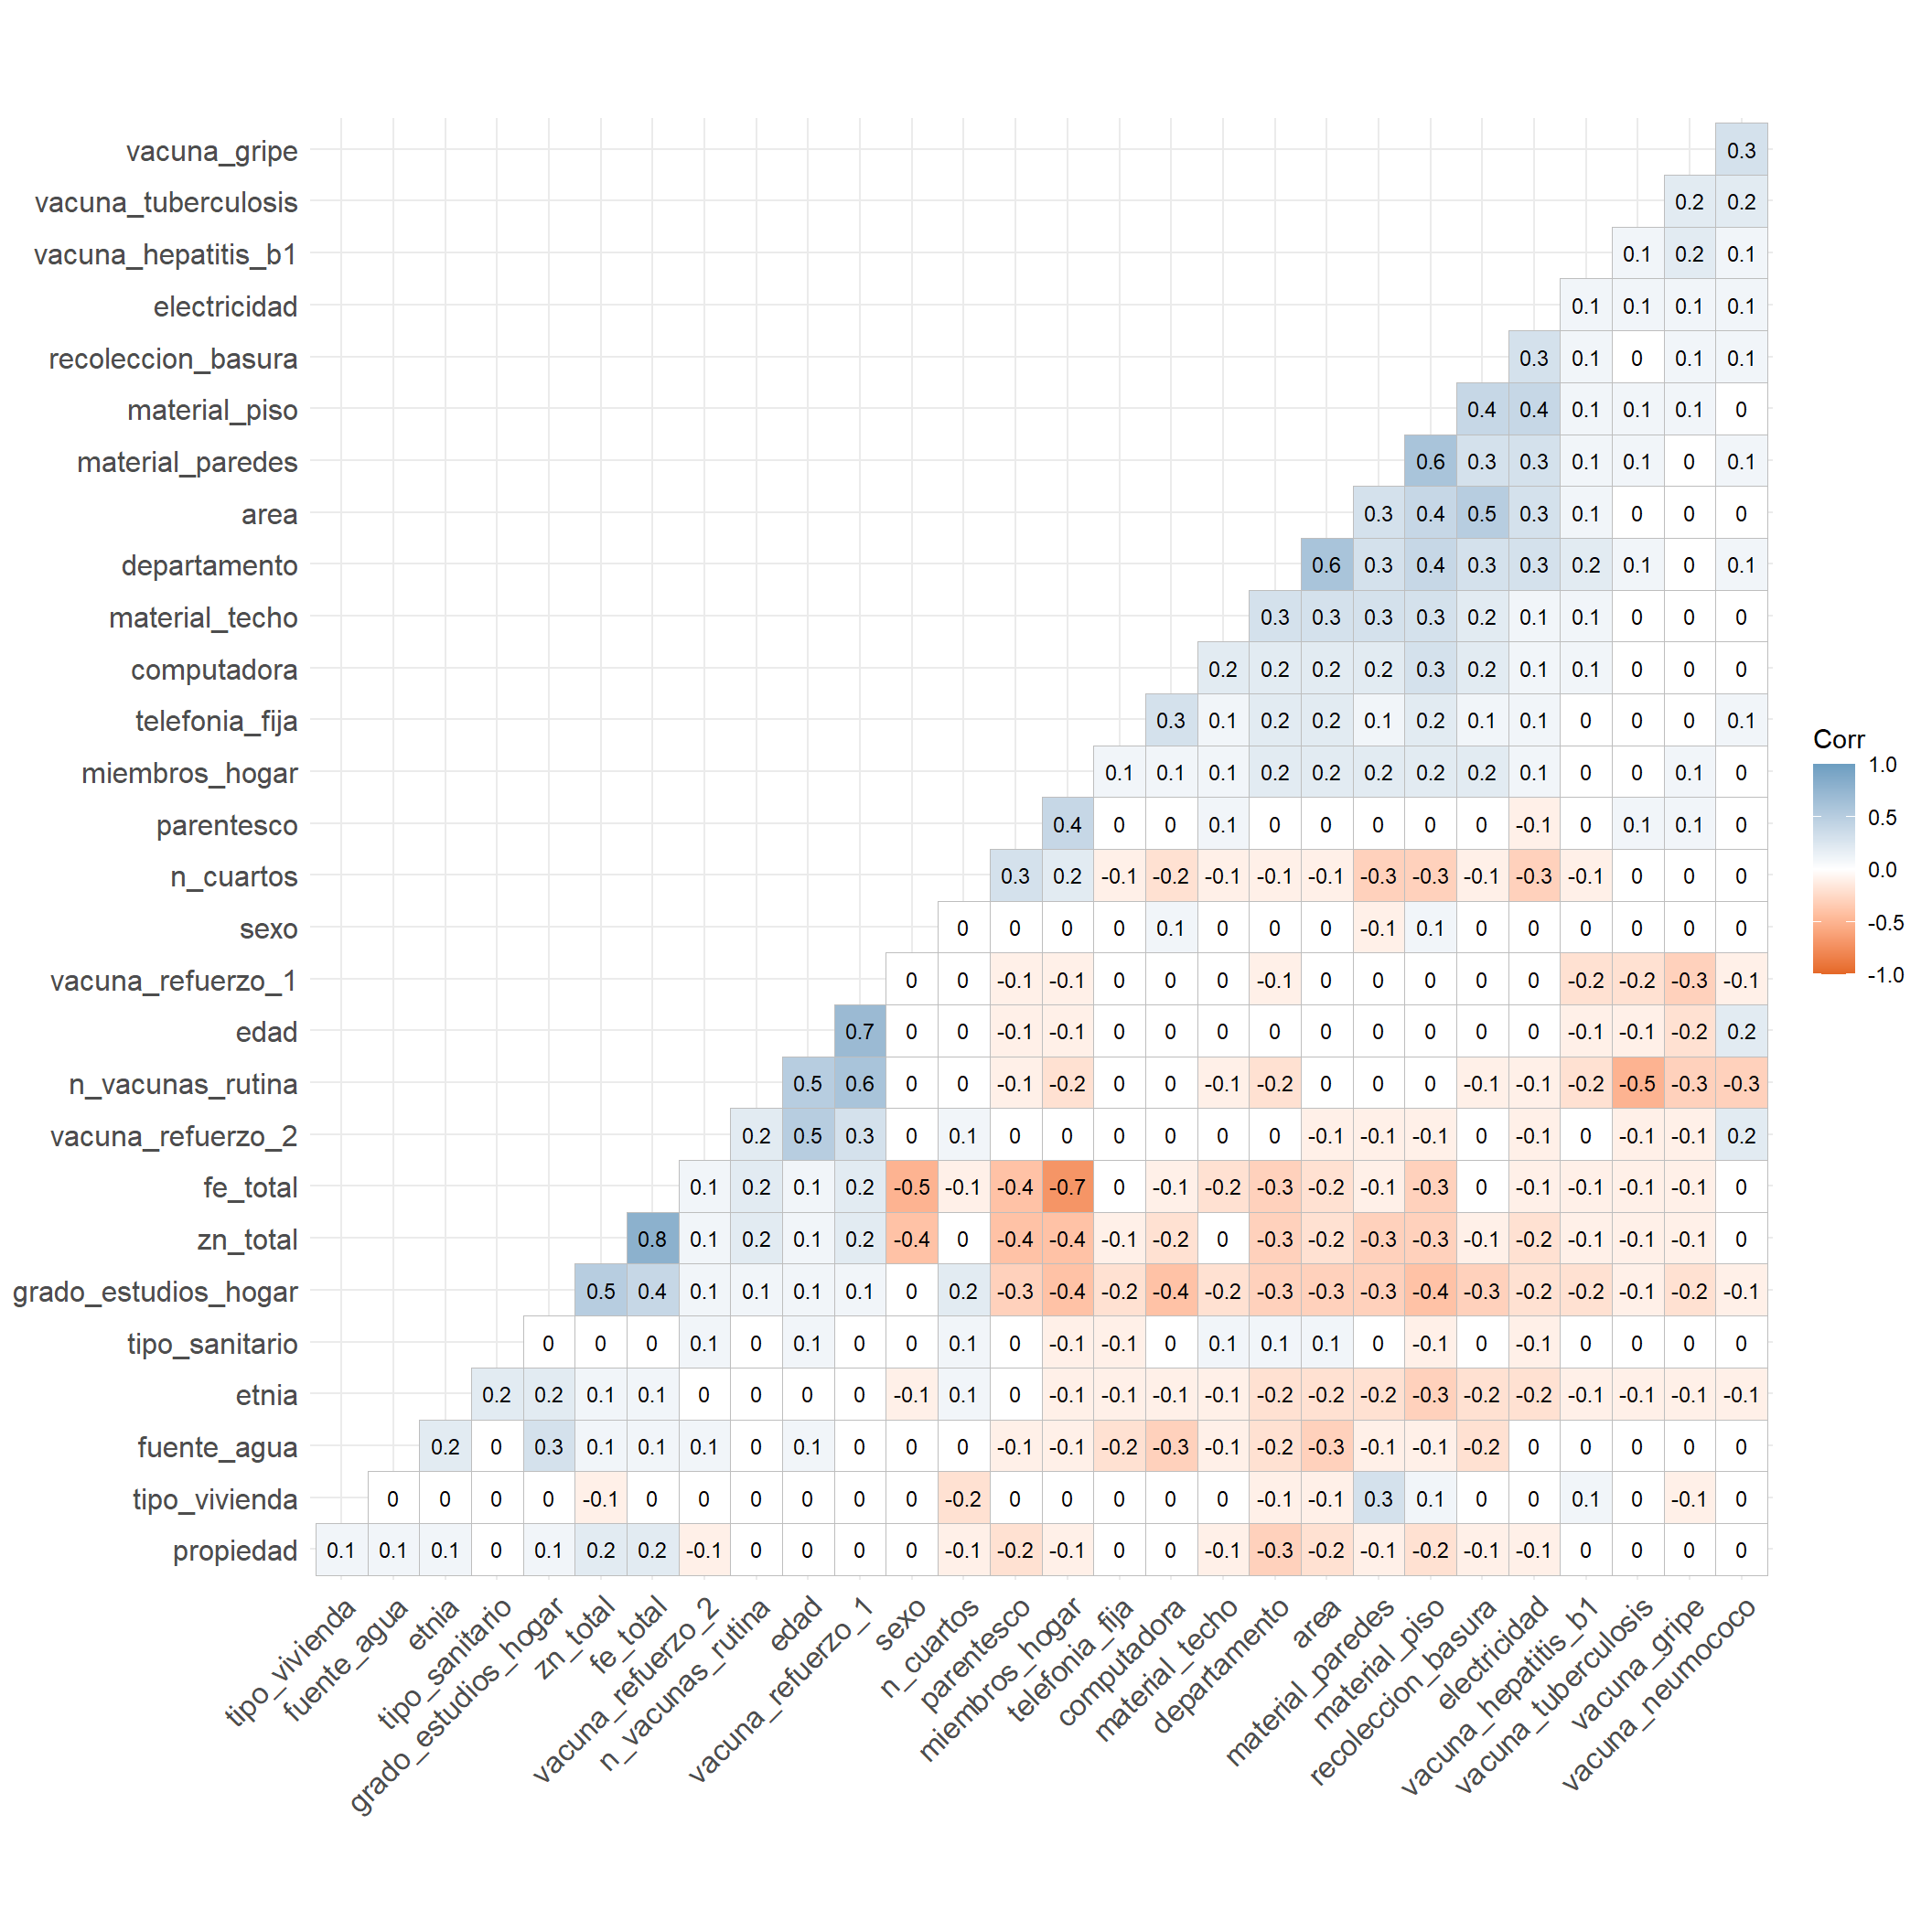
Based on the final graph, it is decided to retain these variables in the analysis model.
Quasi-Zero Variance Study
In this section, variables with nearly zero variance will be evaluated, as they contribute little information to the model.
Variable | Frequency Ratio | Unique percentage | NZV |
|---|---|---|---|
parentesco | 2.493274 | 0.9950249 | FALSE |
edad | 1.176471 | 0.6218905 | FALSE |
sexo | 1.025189 | 0.2487562 | FALSE |
etnia | 1.496894 | 0.2487562 | FALSE |
departamento | 1.776471 | 2.7363184 | FALSE |
area | 1.955882 | 0.2487562 | FALSE |
miembros_hogar | 1.116438 | 1.6169154 | FALSE |
grado_estudios_hogar | 1.696429 | 1.3681592 | FALSE |
propiedad | 6.698925 | 0.4975124 | FALSE |
tipo_vivienda | 30.640000 | 0.7462687 | TRUE |
material_paredes | 2.710692 | 0.9950249 | FALSE |
material_techo | 5.601770 | 0.7462687 | FALSE |
material_piso | 1.234043 | 0.7462687 | FALSE |
n_cuartos | 1.164751 | 0.9950249 | FALSE |
tipo_sanitario | 2.654545 | 0.2487562 | FALSE |
fuente_agua | 2.555556 | 0.8706468 | FALSE |
recoleccion_basura | 3.953125 | 0.4975124 | FALSE |
electricidad | 5.330709 | 0.2487562 | FALSE |
telefonia_fija | 31.160000 | 0.2487562 | TRUE |
computadora | 8.458824 | 0.2487562 | FALSE |
fe_total | 1.000000 | 99.7512438 | FALSE |
zn_total | 1.500000 | 97.1393035 | FALSE |
prot_total | 1.000000 | 100.0000000 | FALSE |
lys_total | 1.000000 | 100.0000000 | FALSE |
trp_total | 1.000000 | 100.0000000 | FALSE |
per_vegetales | 1.000000 | 99.1293532 | FALSE |
vacuna_gripe | 1.913043 | 0.2487562 | FALSE |
vacuna_neumococo | 1.045802 | 0.2487562 | FALSE |
vacuna_hepatitis_b1 | 1.132626 | 0.2487562 | FALSE |
vacuna_tuberculosis | 16.478261 | 0.2487562 | FALSE |
vacuna_refuerzo_1 | 1.671096 | 0.2487562 | FALSE |
vacuna_refuerzo_2 | 6.730769 | 0.2487562 | FALSE |
n_vacunas_rutina | 5.954545 | 1.2437811 | FALSE |
In this case, we observe that there are two variables with almost zero variance and, therefore, will not provide relevant information to the model.
Yeo-Johnson Evaluation of Continuous Predictor Variables
In this section, the normality of continuous variables will be assessed to determine if they need to be transformed.
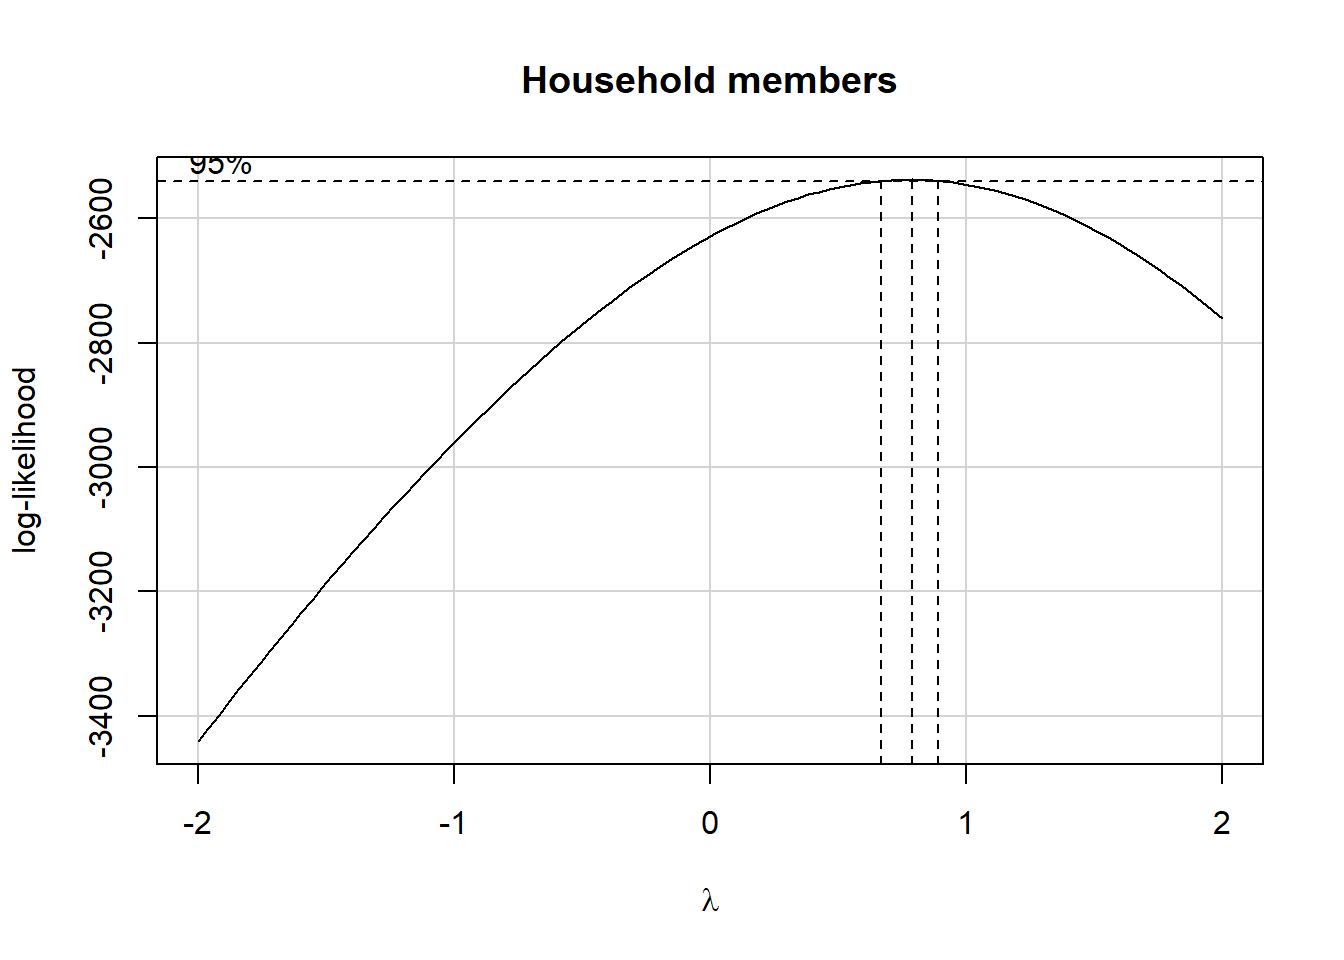

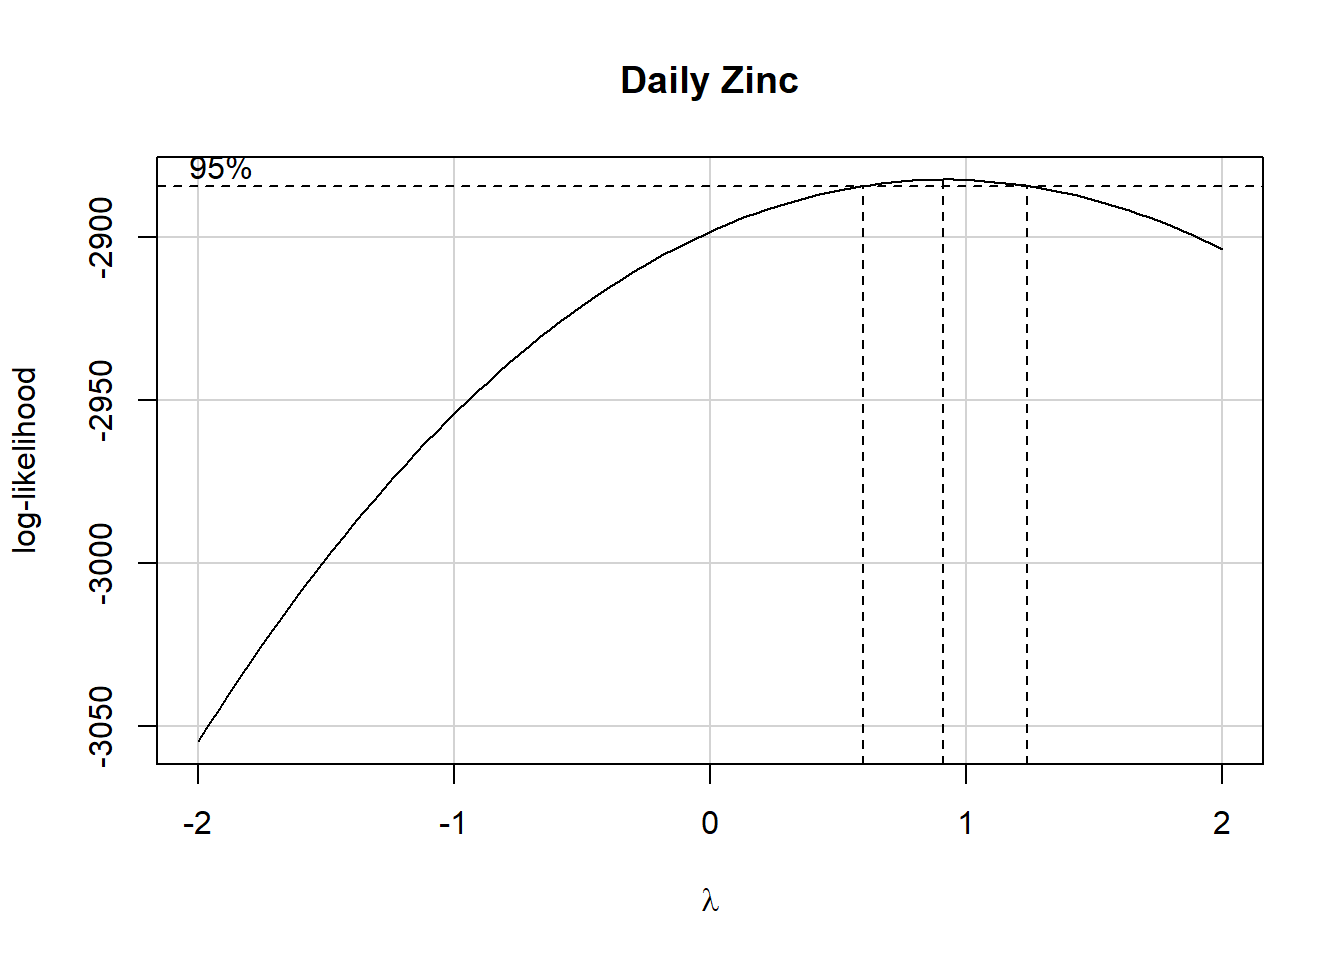
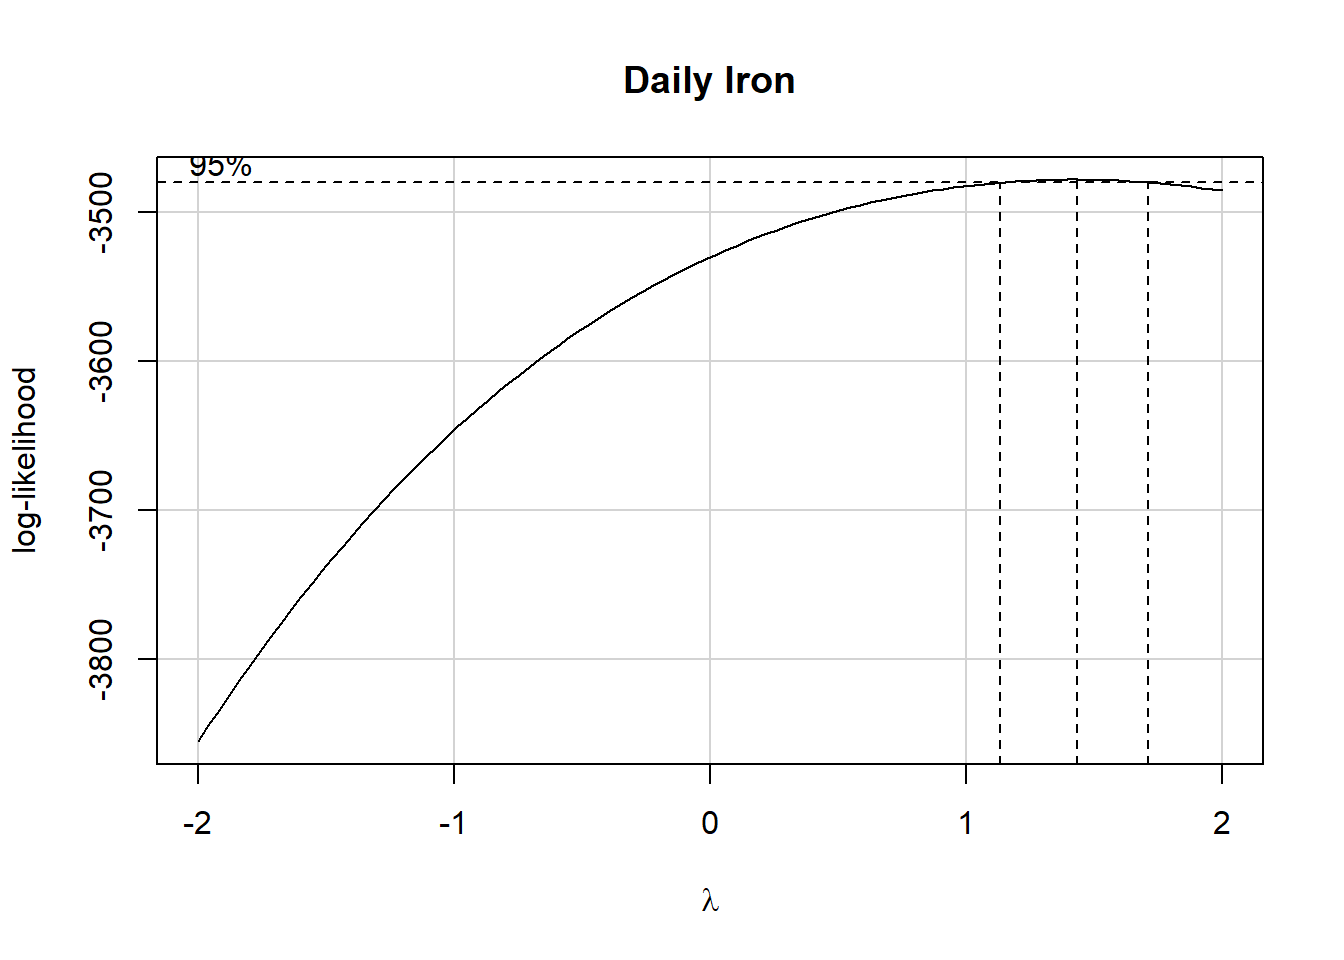
Given these results, all variables exhibit quasi-normality. It should be noted that the variables for the number of rooms and household members had already been adjusted in the models of the nutritional variable profiles.