Considerations on Food Bioavailability
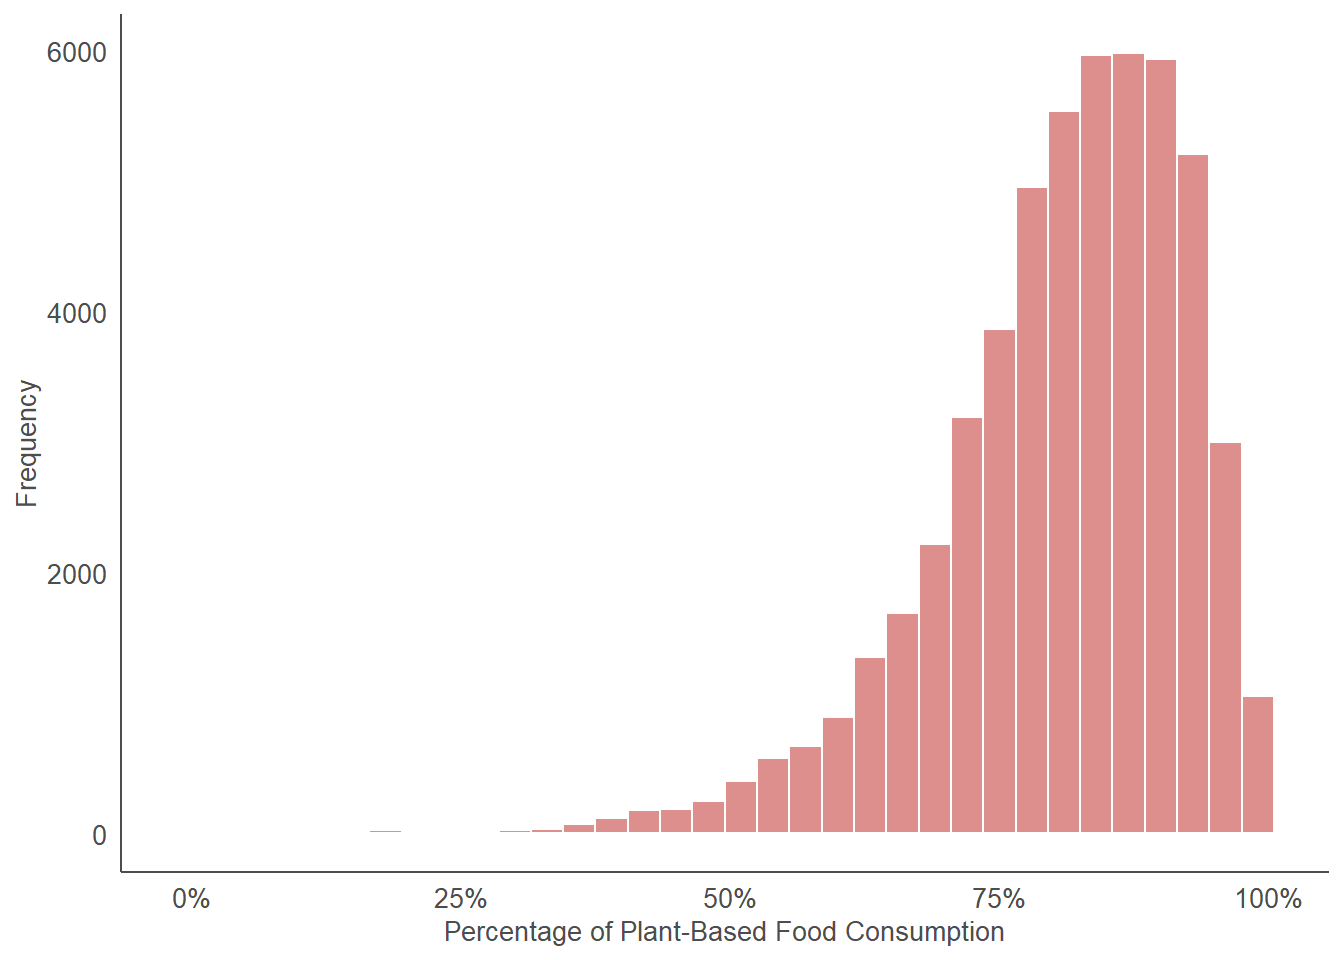
Population Distribution Regarding the Percentage of Consumption of Plant-Based Foods
In view of this histogram, the following bioavailability percentage distribution was applied to the population, based on their percentage of vegetable consumption in the diet.
Percentage of Plant-Based Foods | Zinc Bioavailability | Iron Bioavailability | Population Proportion |
|---|---|---|---|
100% - 90% | 15% | 5% | 23.43 % |
90% - 70% | 18.5% | 9.8% | 61.09 % |
70% - 50% | 20% | 14% | 13.8 % |
50% - 0% | 25% | 18% | 1.68 % |
Adult Male Equivalent (AME) Coding
This section presents the characteristics used for coding the Adult Male Equivalent (AME) in terms of nutritional needs, taking into account the sex and age of the individuals.
Since the ENCOVI survey only provided food intake data at the household level, it was decided to follow this coding of nutritional needs to estimate individual food intake.
Sex | Age | Percentage of AME |
|---|---|---|
Both | 6 to 12 months | 21% |
1 to 2 years | 27% | |
2 to 4 years | 37% | |
4 to 7 years | 44% | |
Male | 7 to 10 years | 56% |
10 to 14 years | 73% | |
14 to 18 years | 96% | |
18 to 30 years | 100% | |
30 to 60 years | 95% | |
over 60 years | 76% | |
Female | 7 to 10 years | 51% |
10 to 14 years | 65% | |
14 to 18 years | 73% | |
18 to 30 years | 74% | |
30 to 60 years | 65% | |
over 60 years | 65% |