Distributions of Nutritional Values
In this section, comparisons of the nutritional values of the populations from ENCOVI 2014 and SIVESNU 2015 are generated.
For this purpose, the distributions of the nutritional values of the populations by department of Guatemala will be compared.
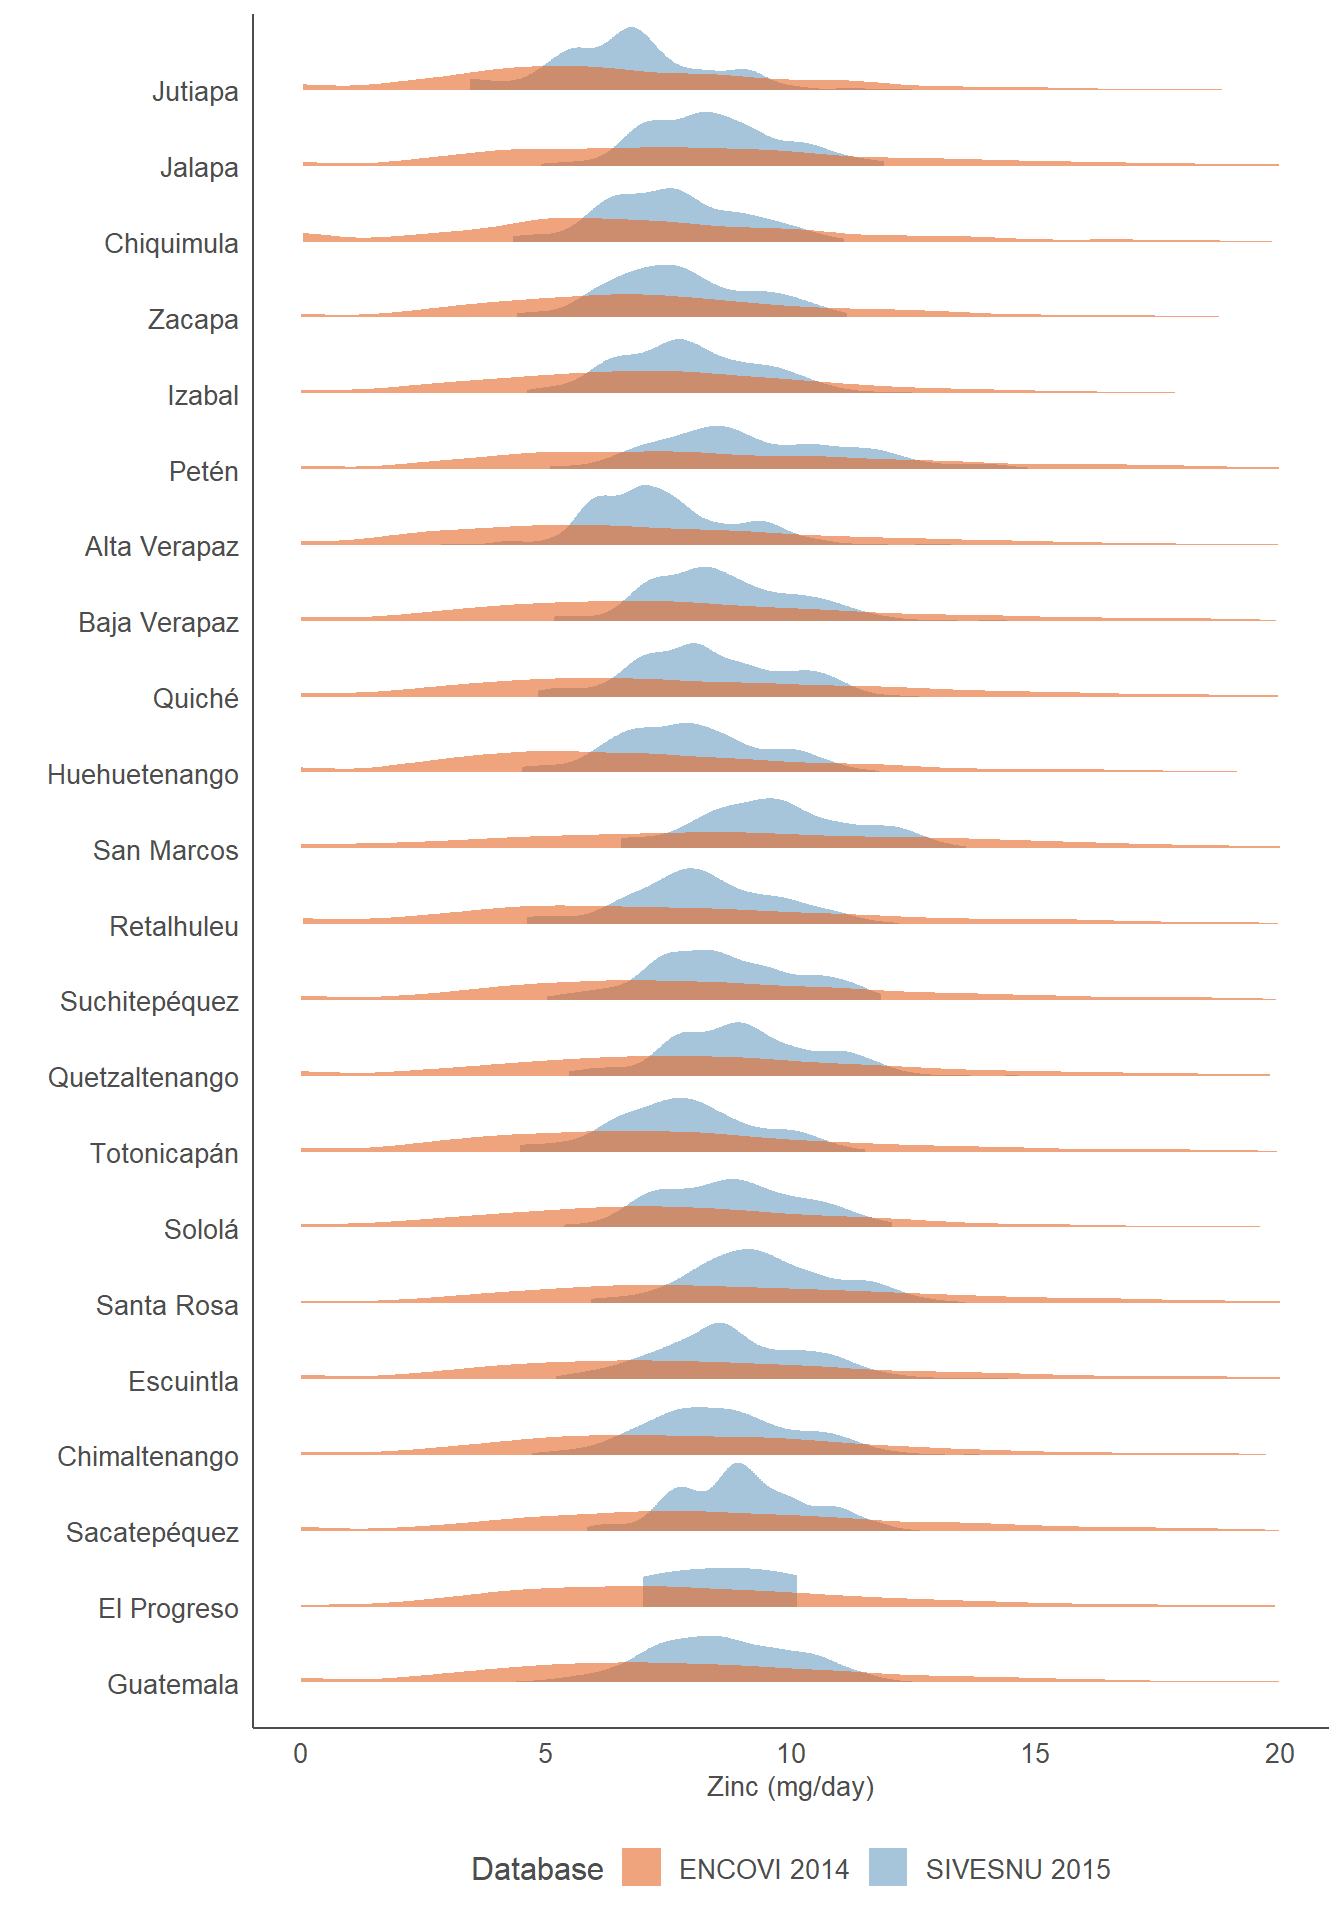
Distribution Chart of Daily Zinc Intake by Department
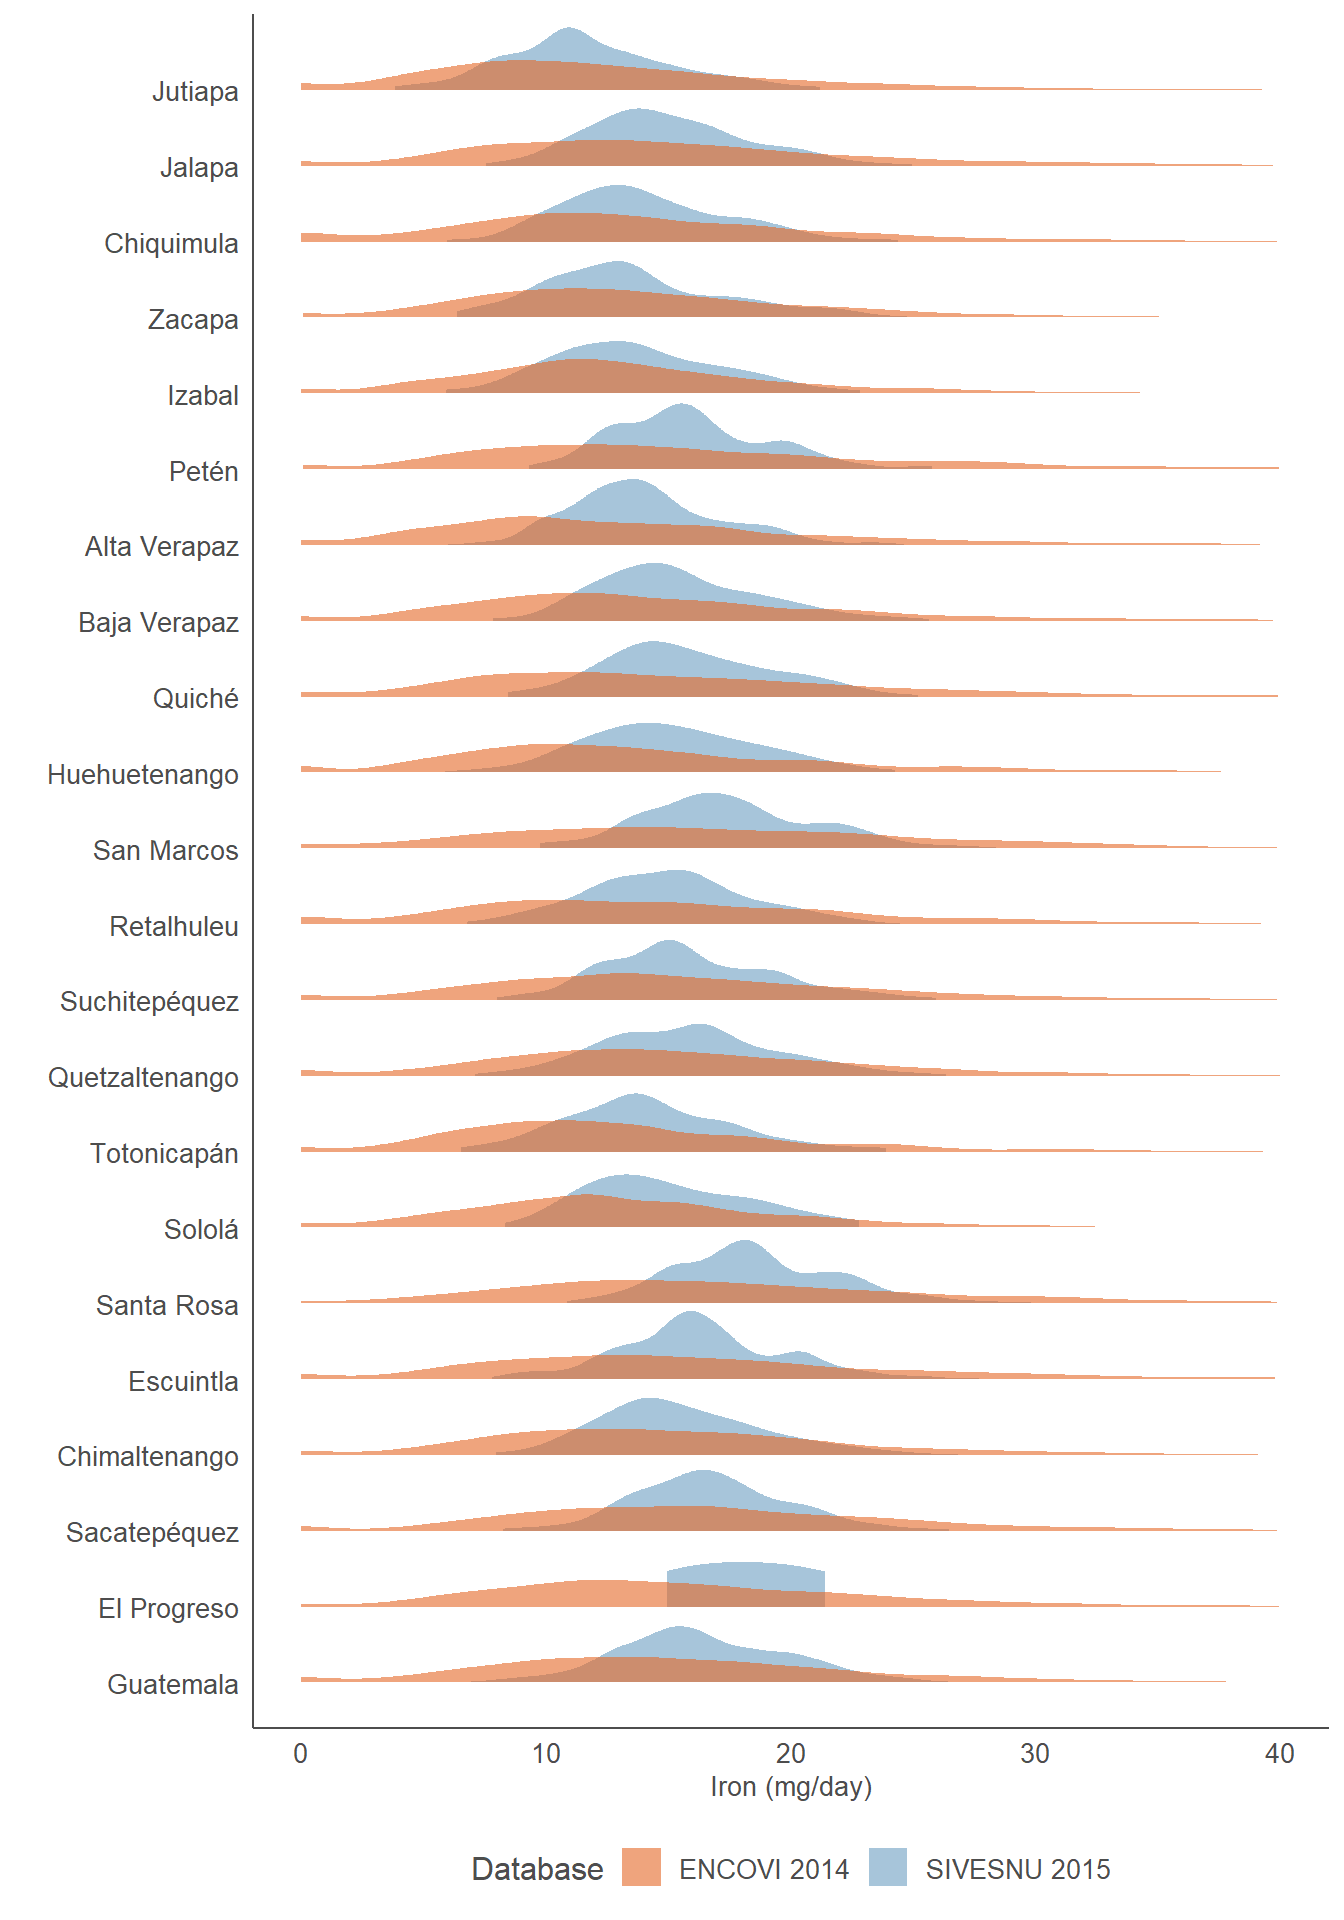
Distribution Chart of Daily Iron Intake by Department
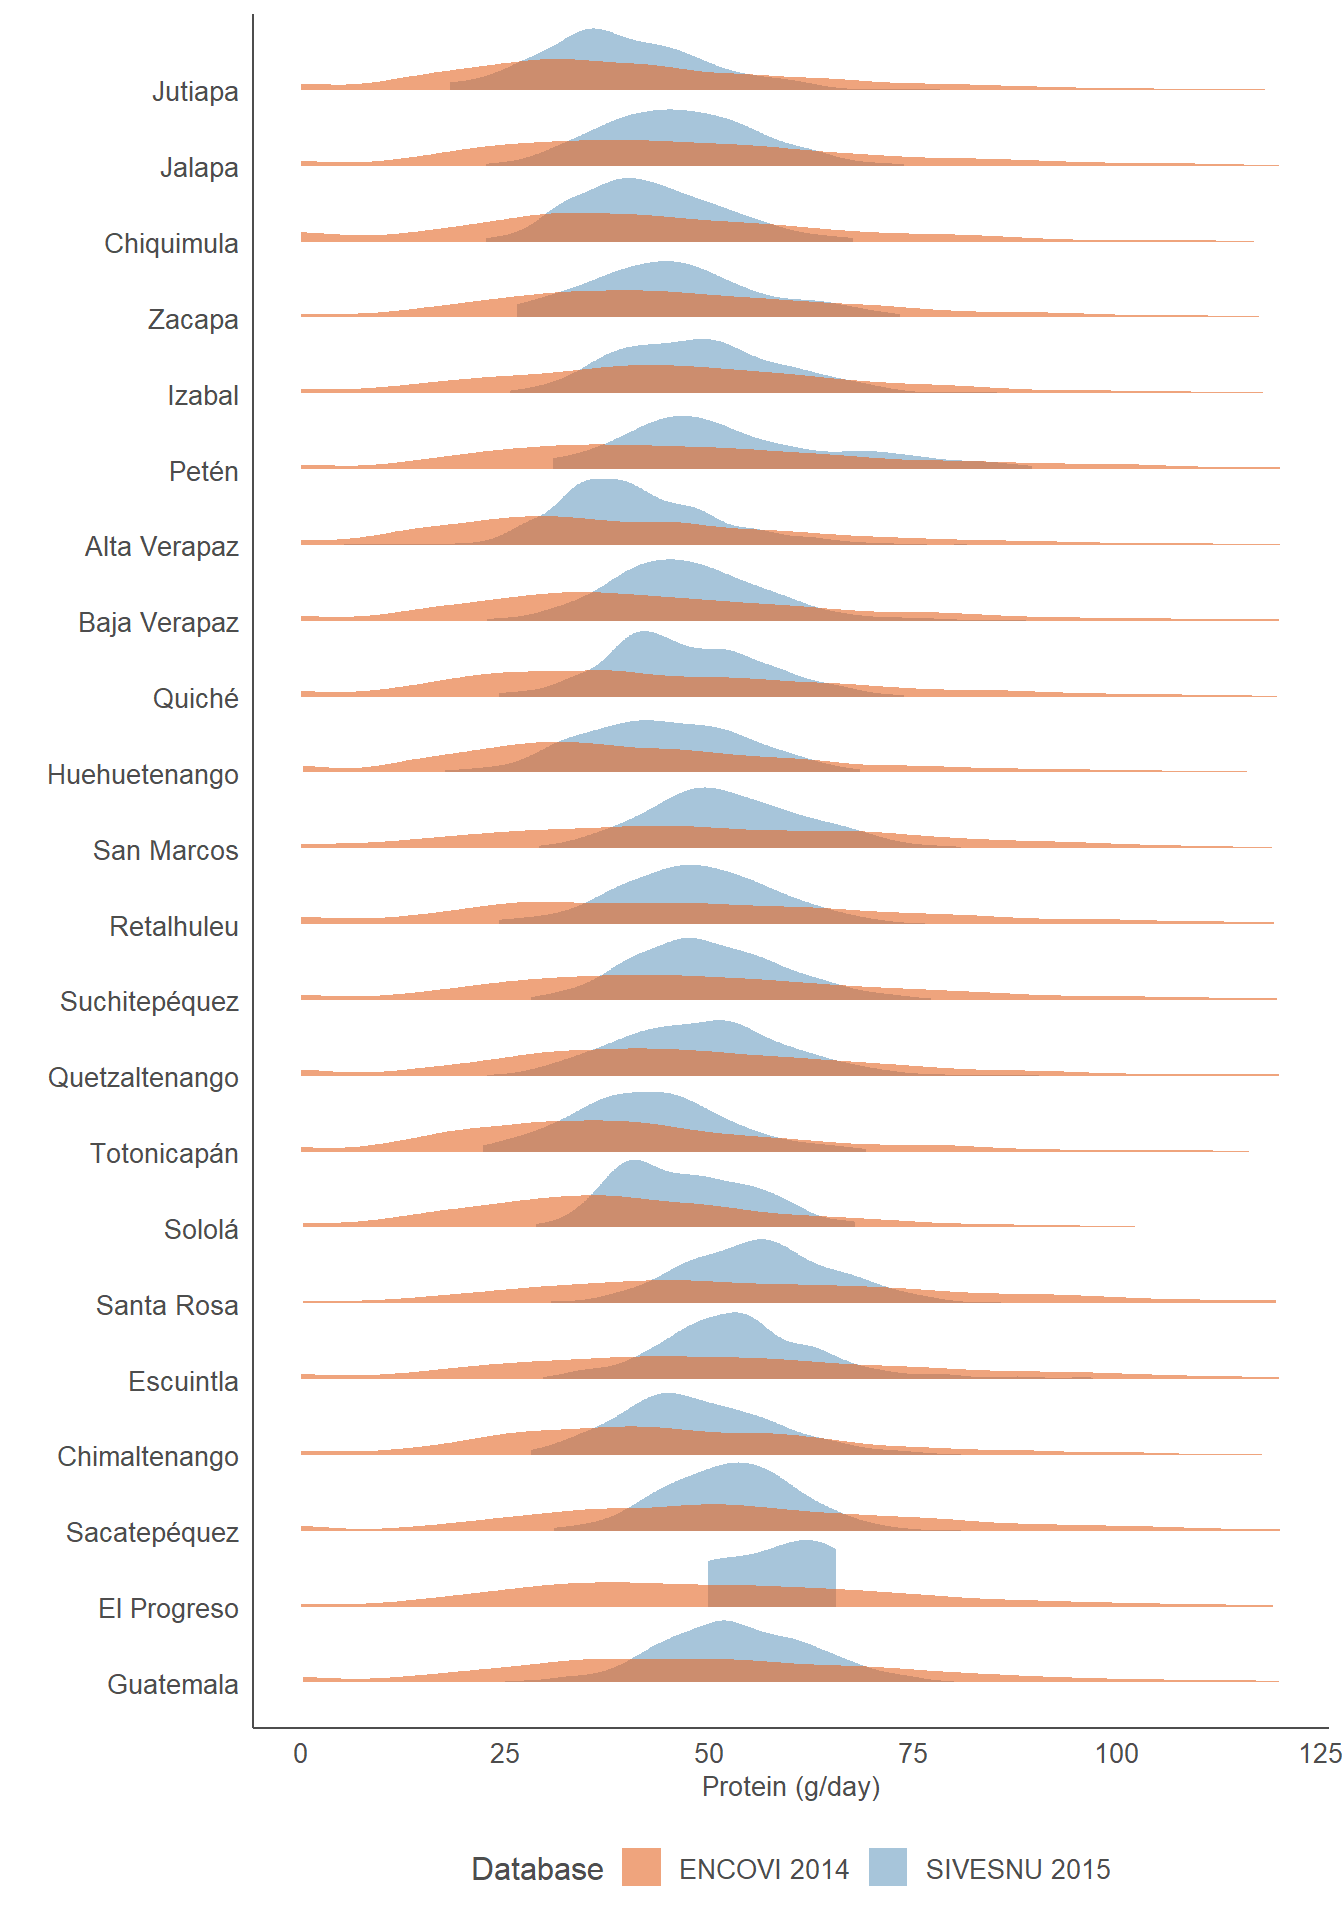
Distribution Chart of Daily Protein Intake by Department
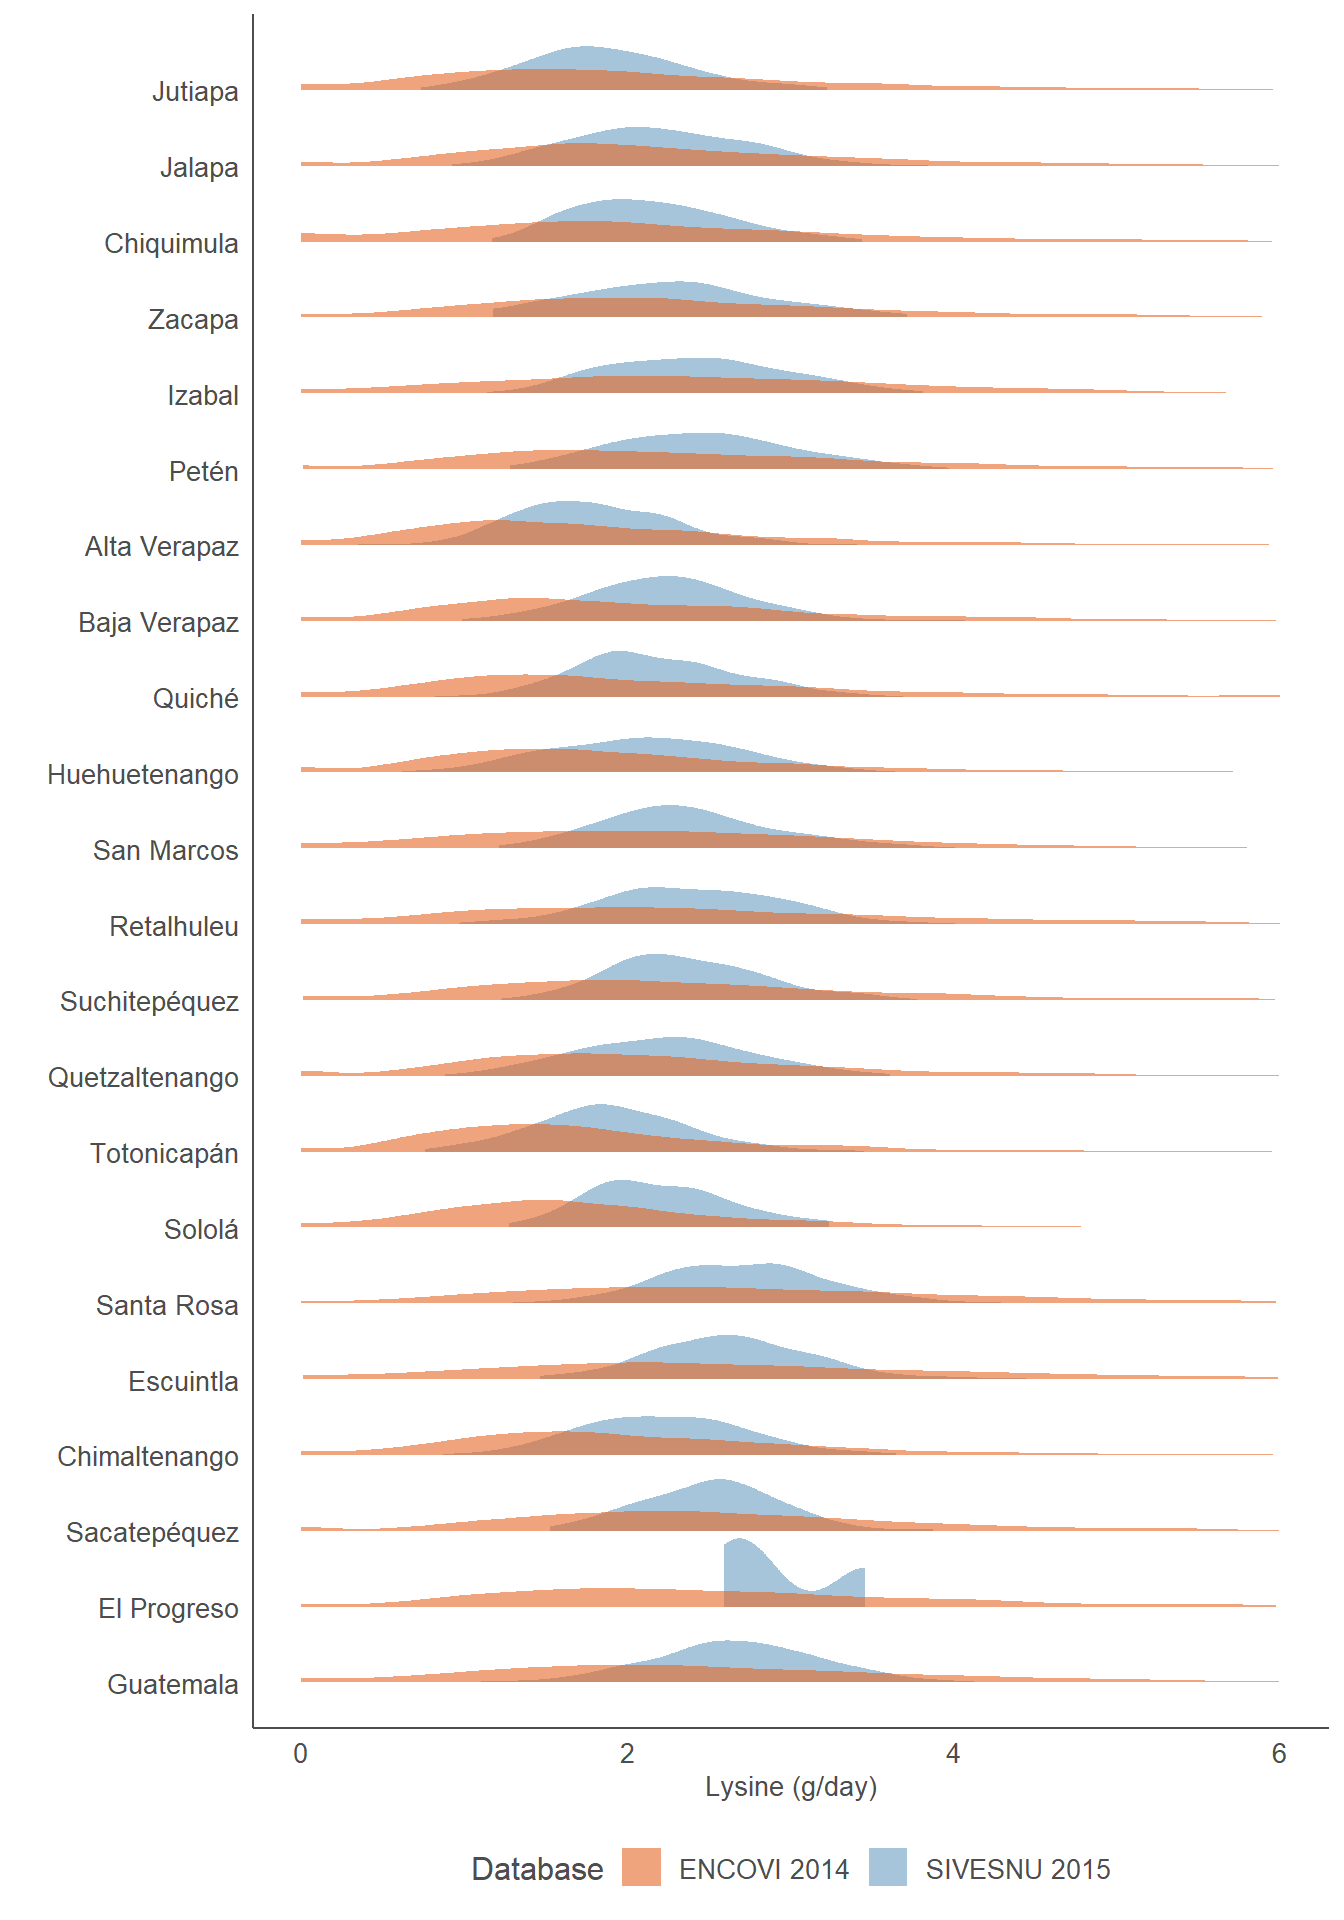
Distribution Chart of Daily Lysine Intake by Department
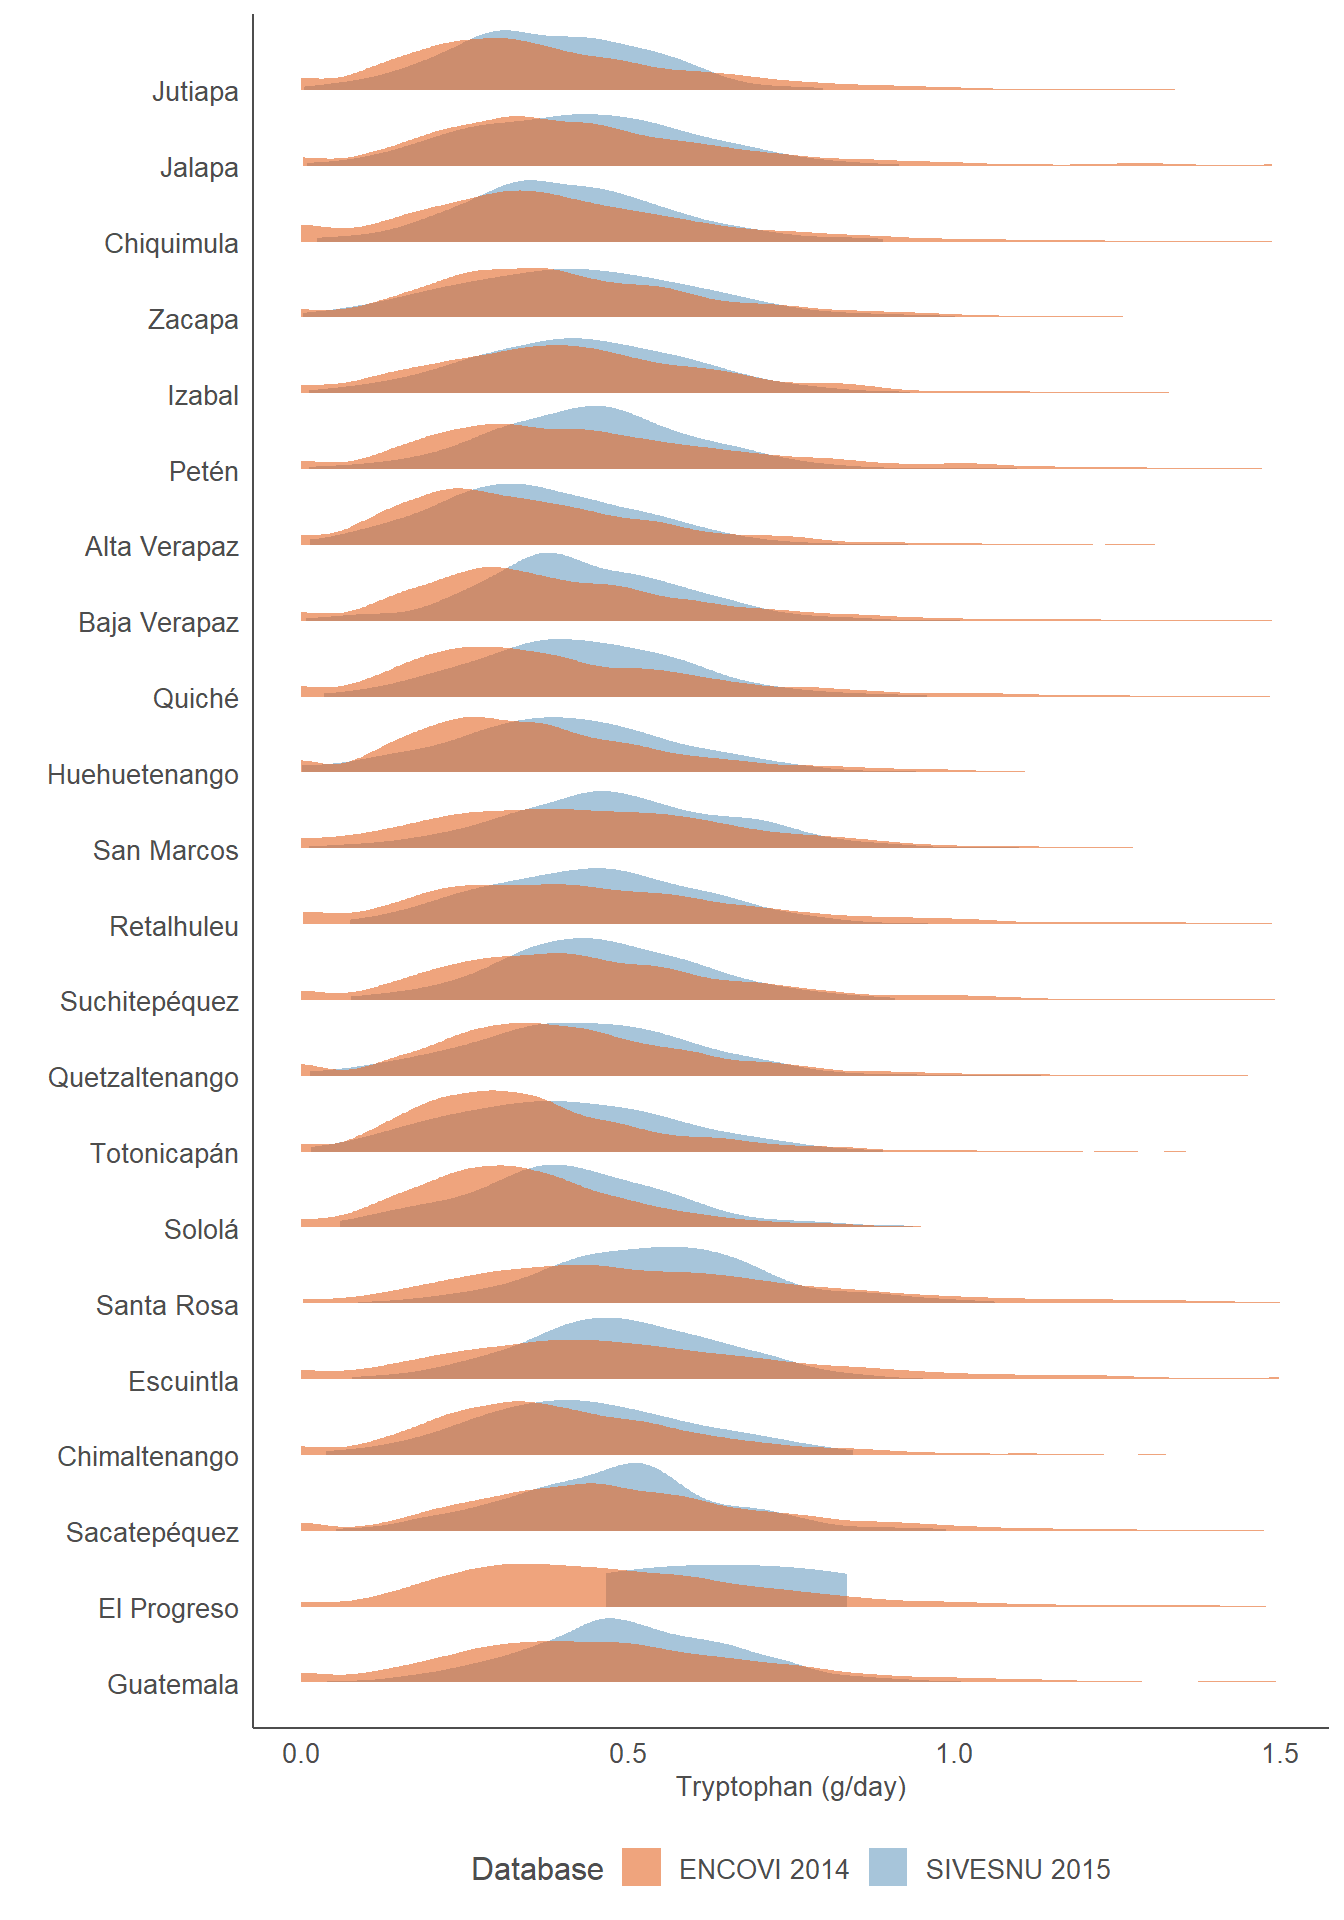
Distribution Chart of Daily Tryptophan Intake by Department