Effect Charts of the Nutritional Model from ENCOVI 2014 for Protein
Effect Charts for the Generalized Linear Regression Models for Protein Intake in the ENCOVI 2014 Database Based on Corn and Other Foods.
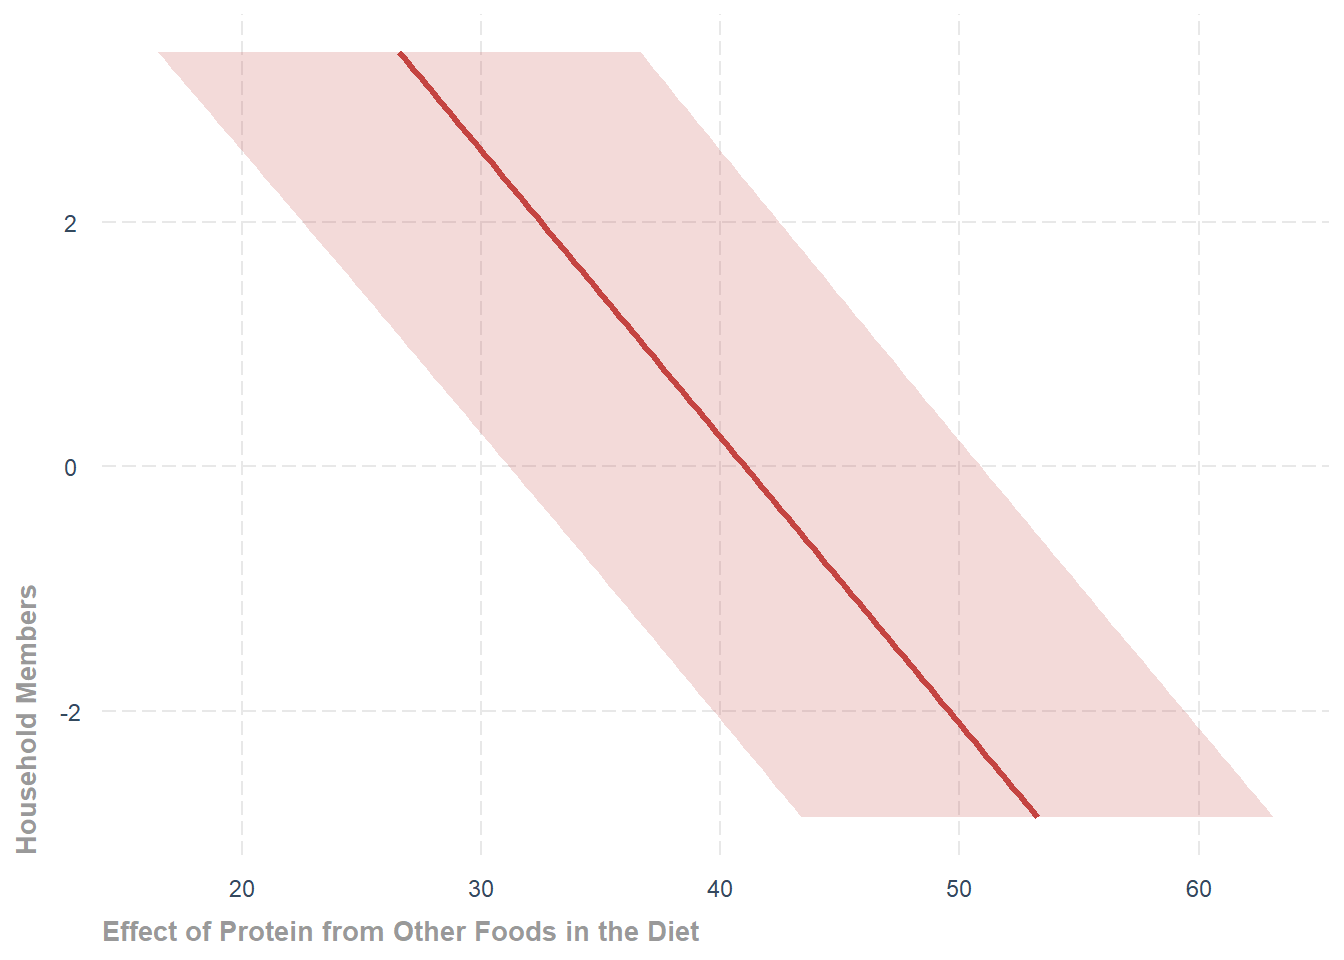
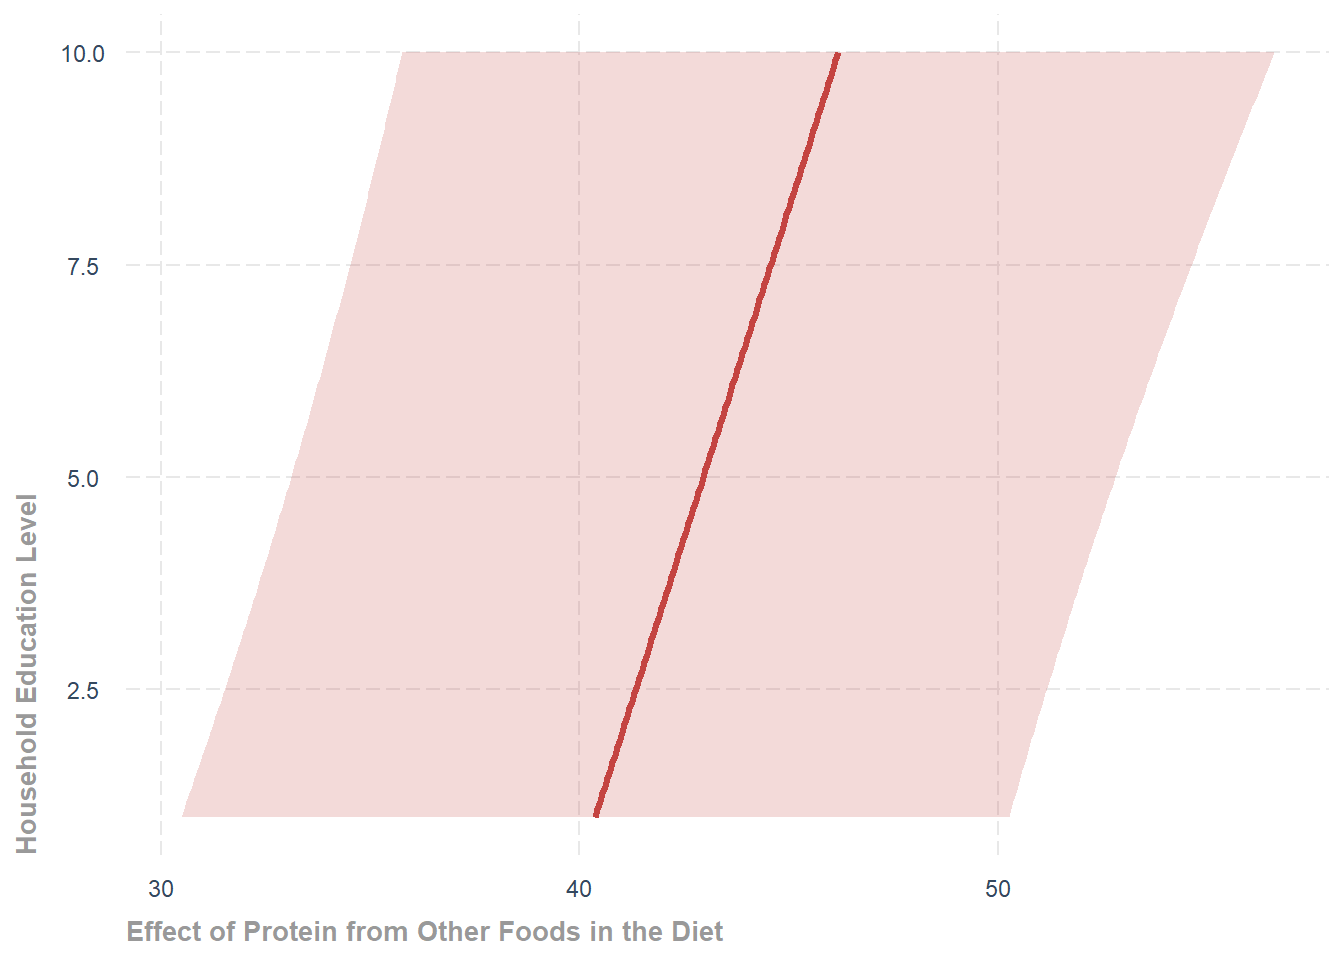
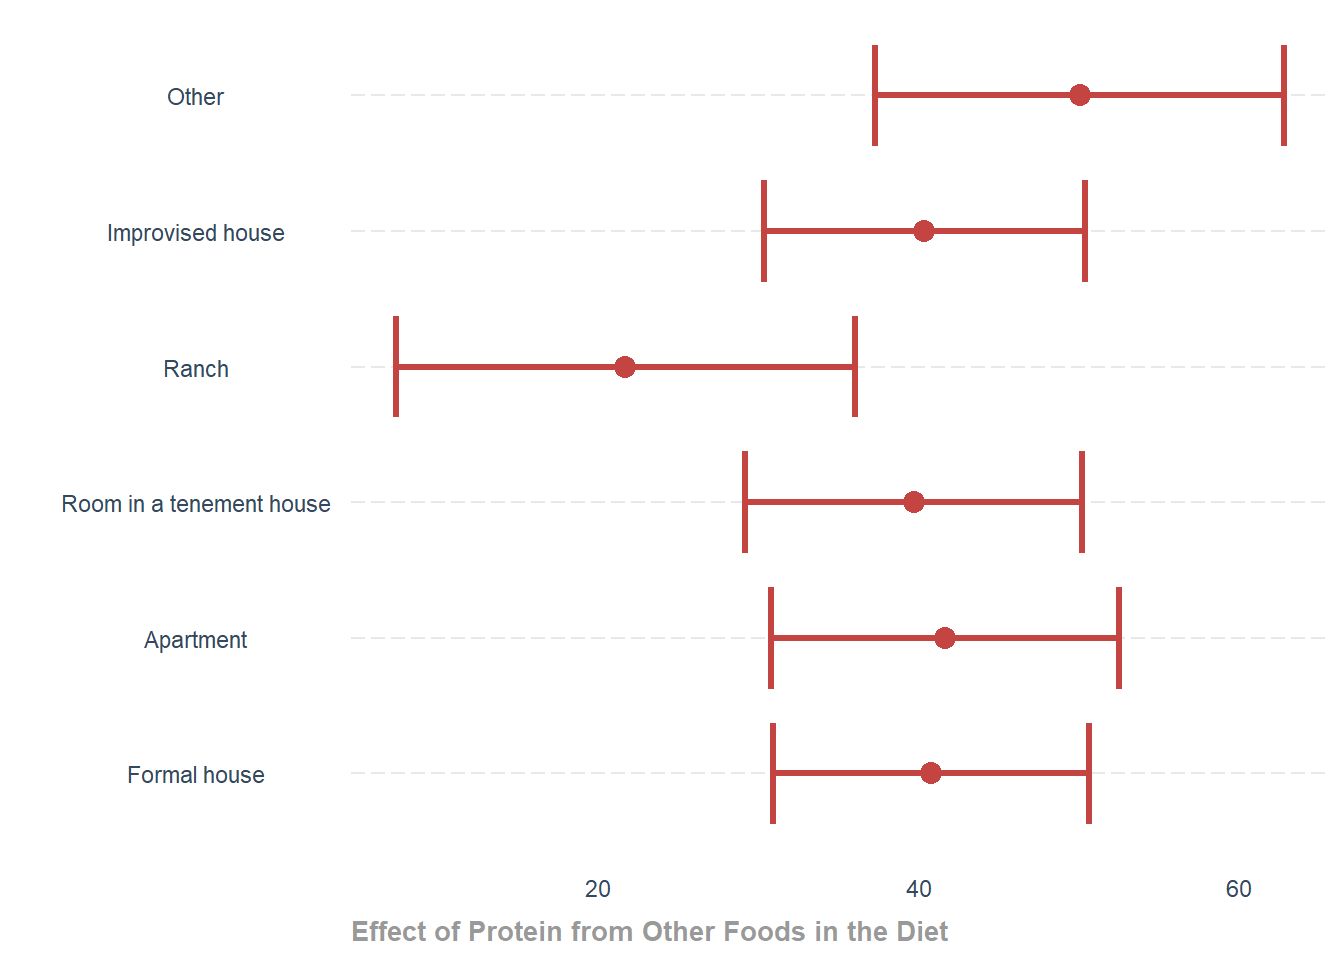
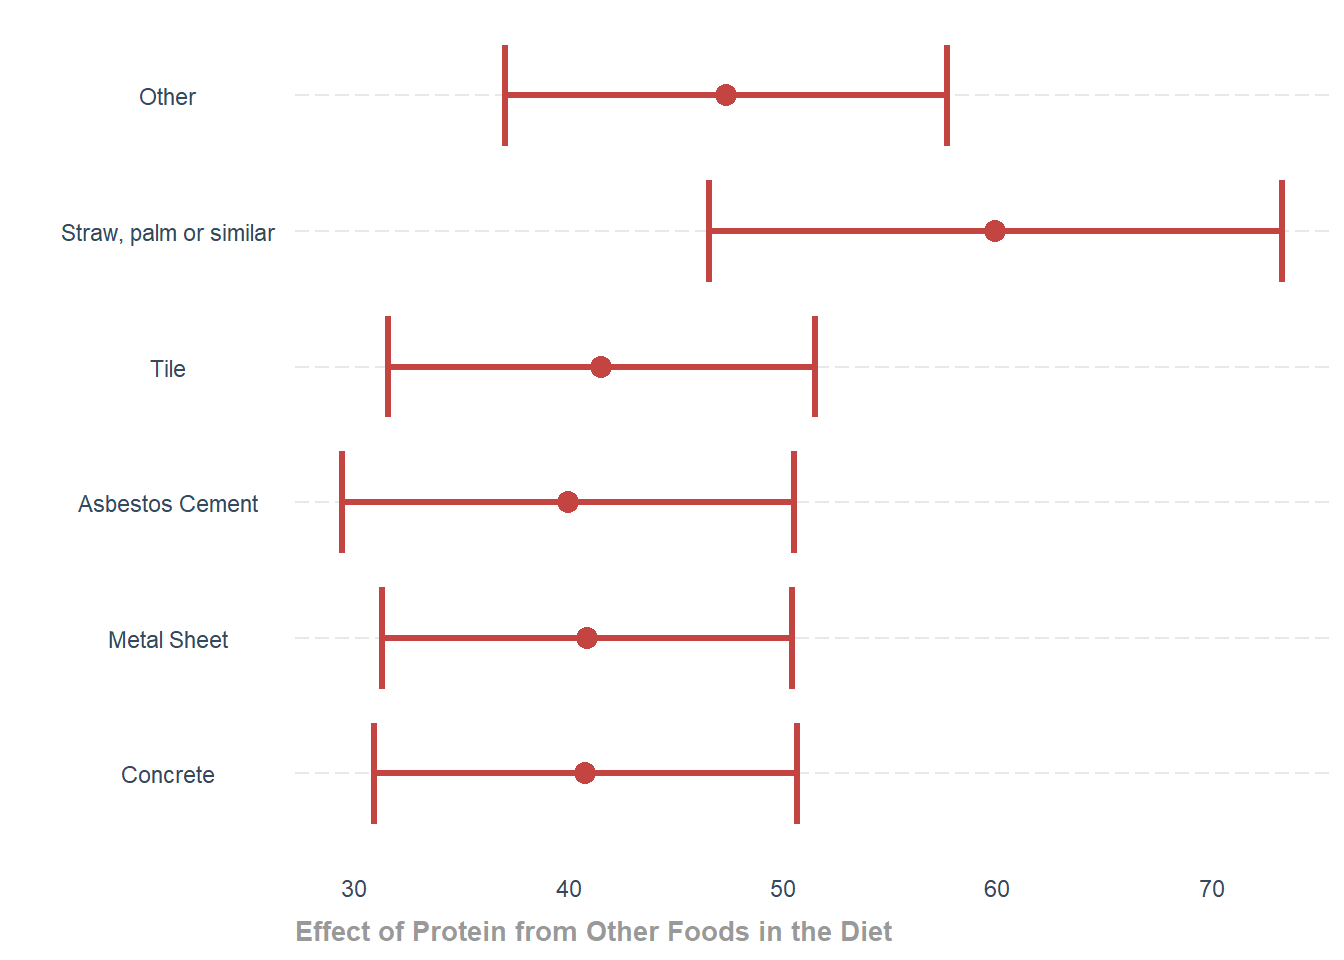
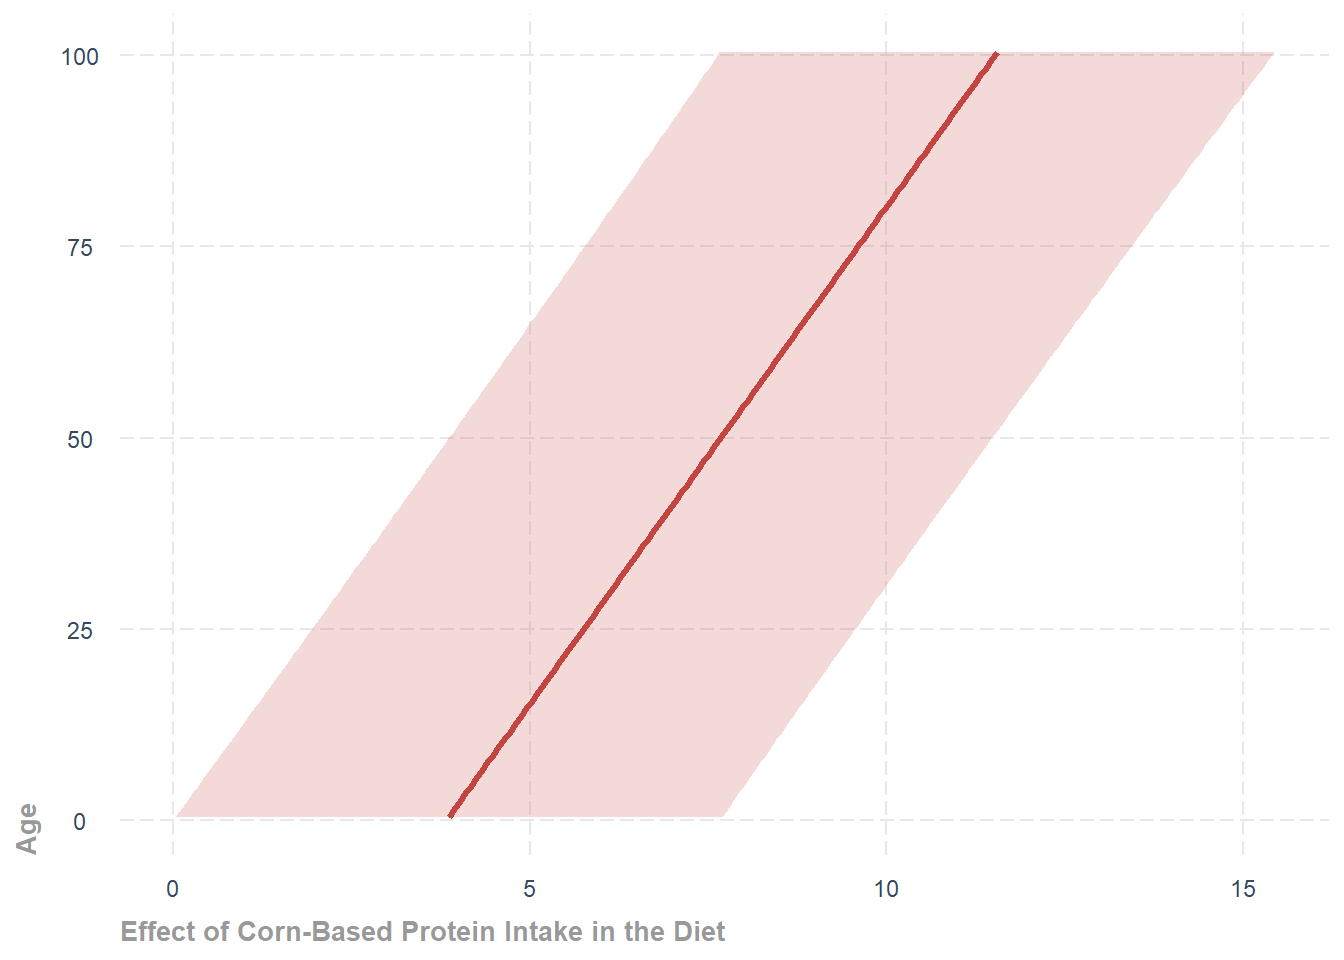
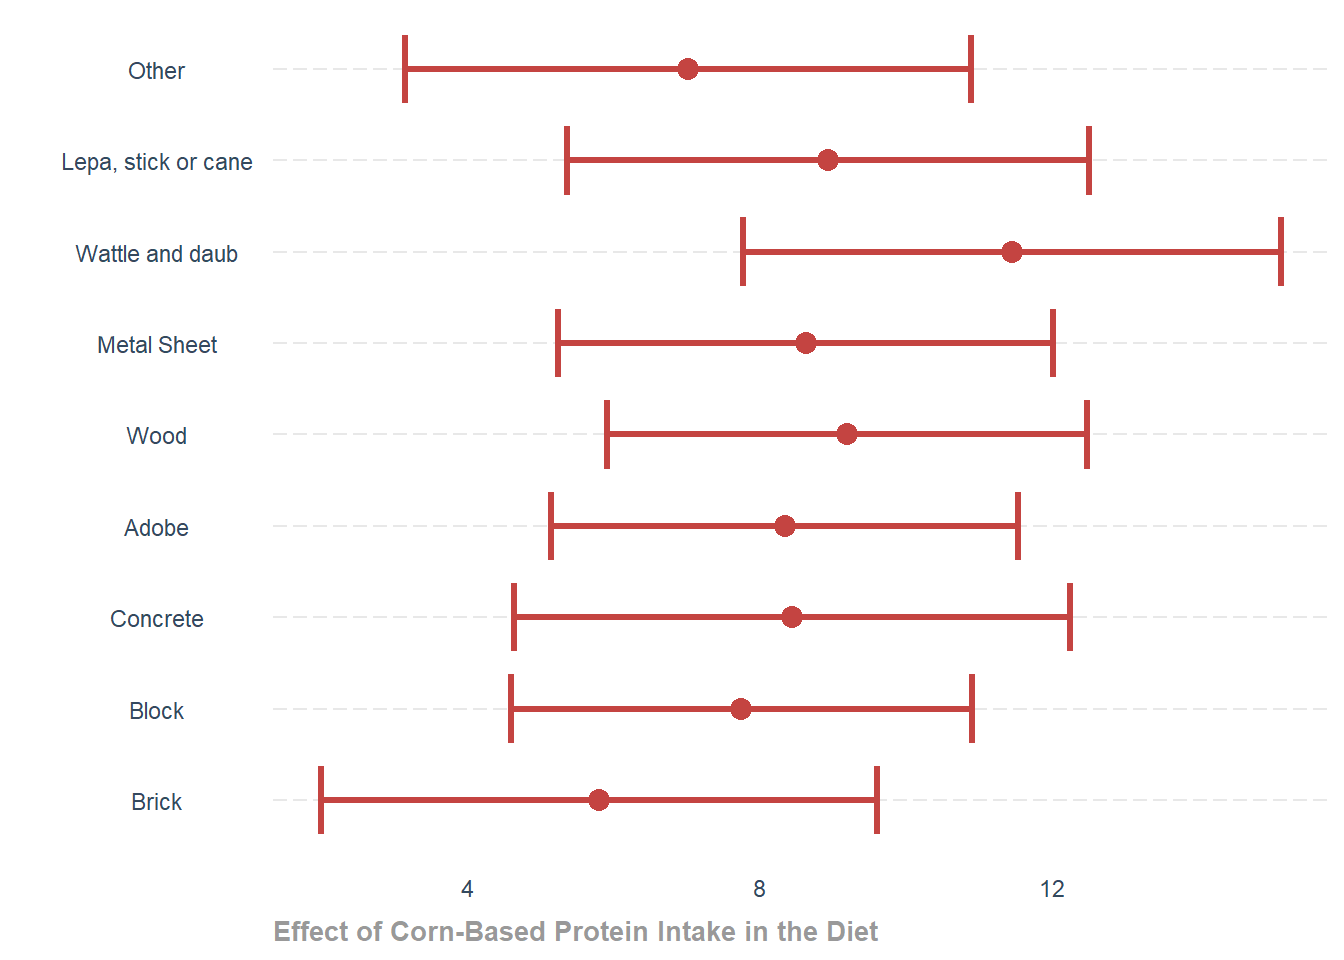
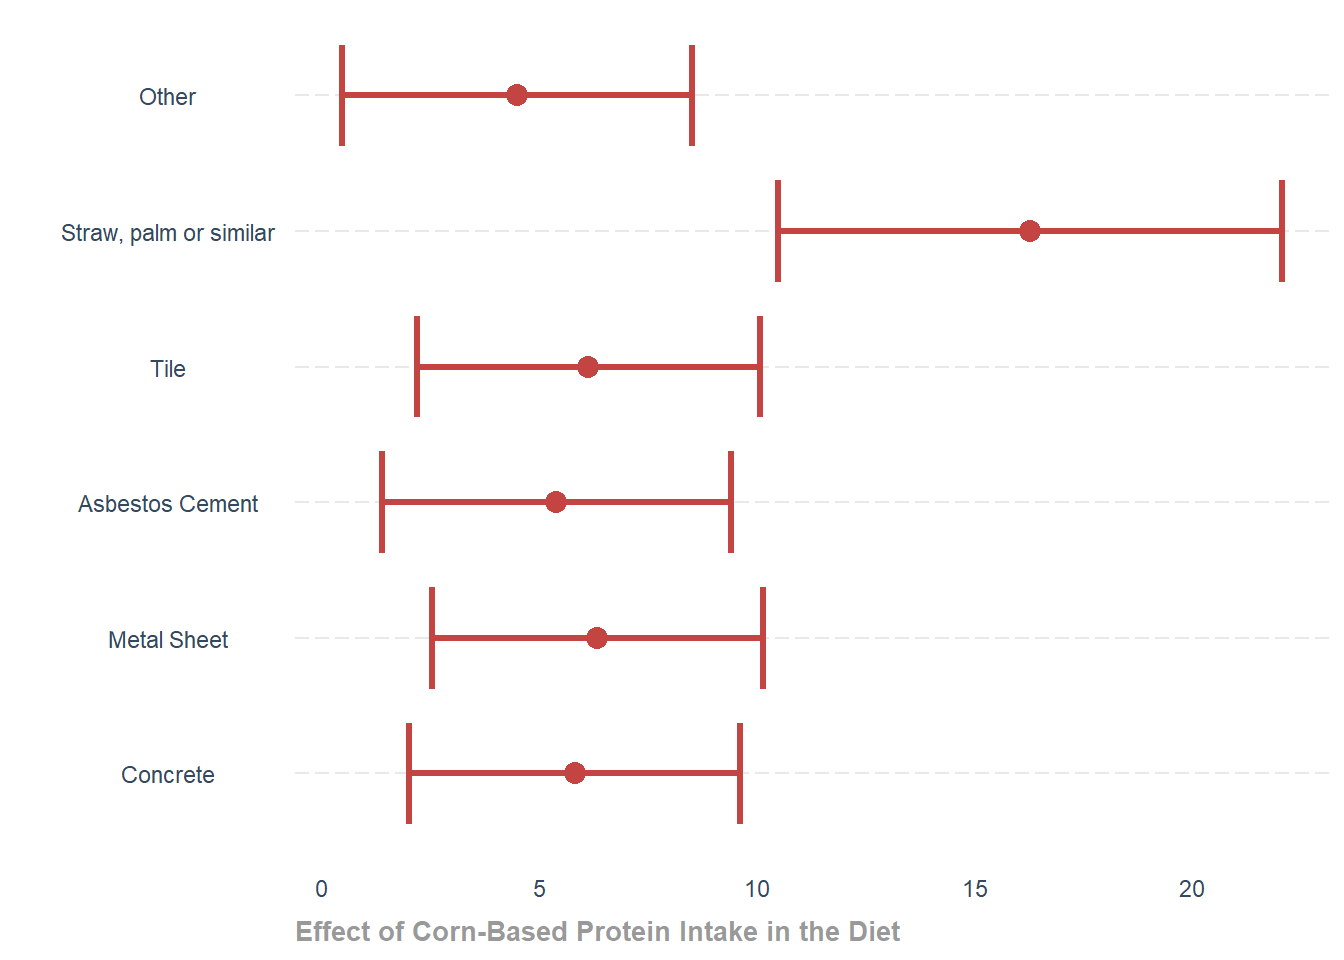
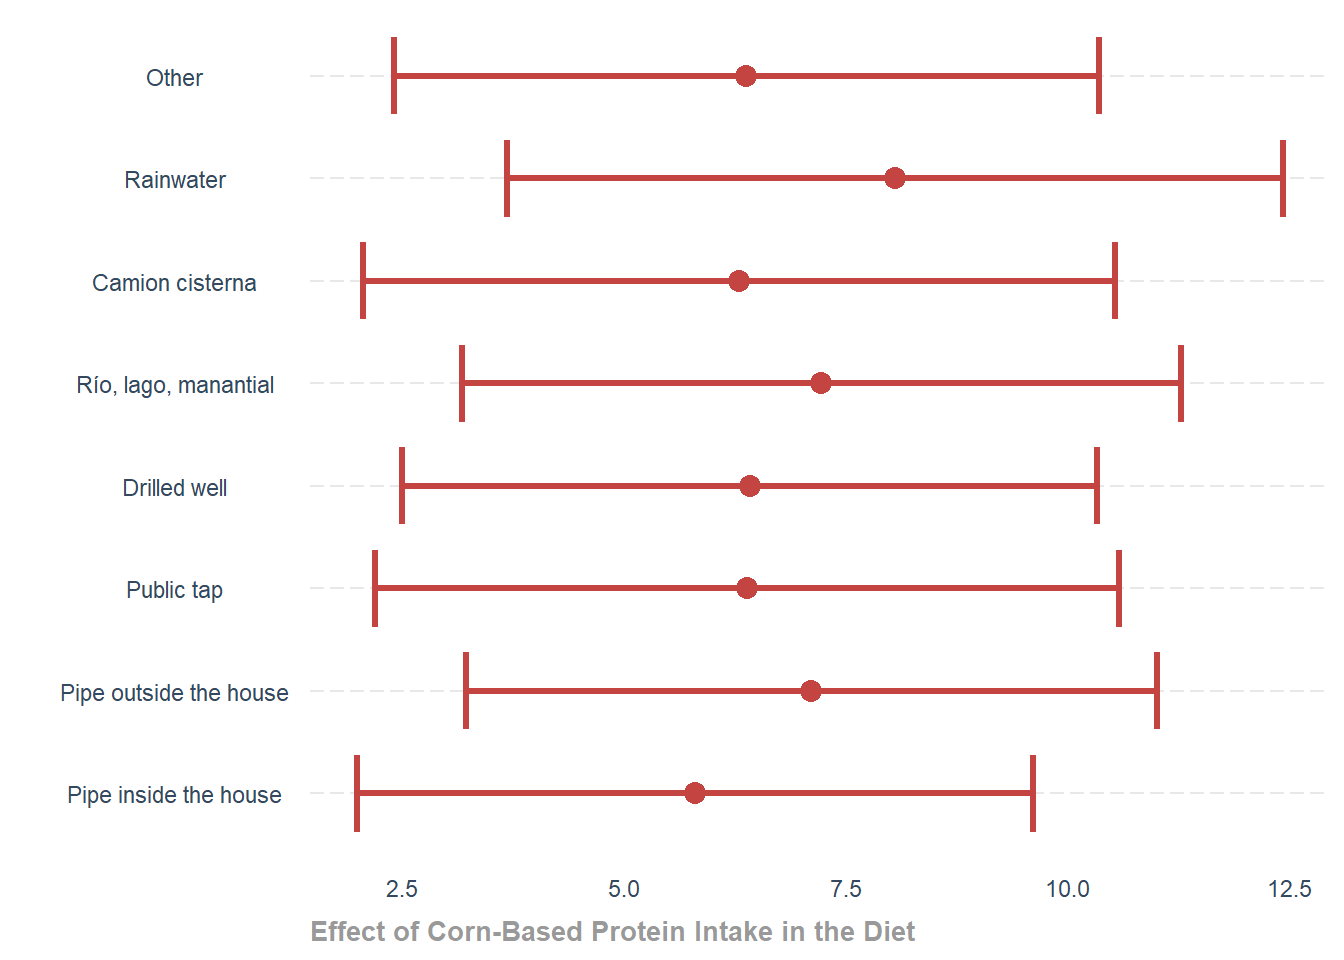
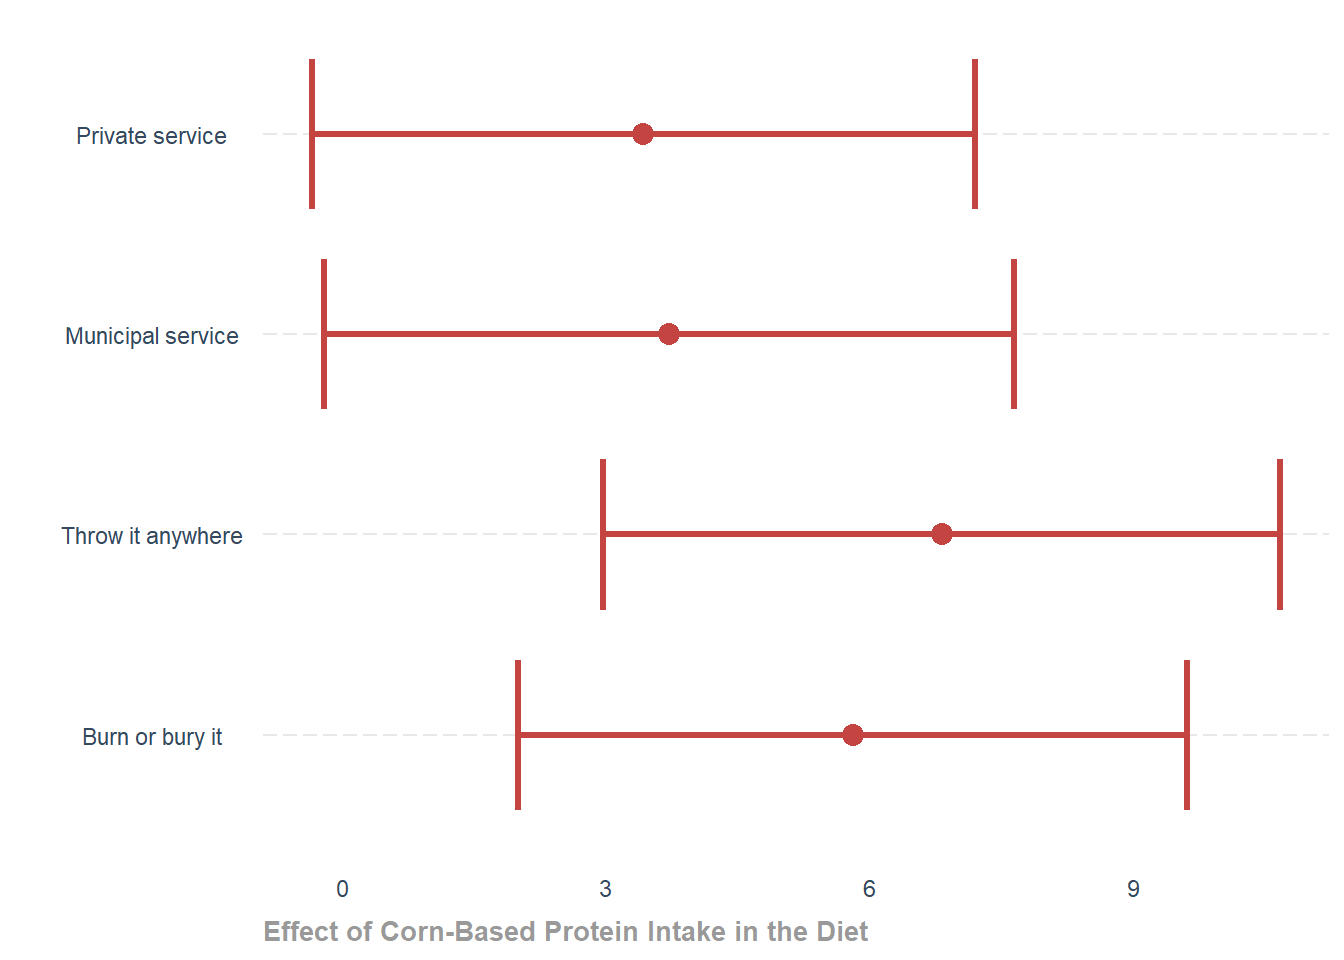
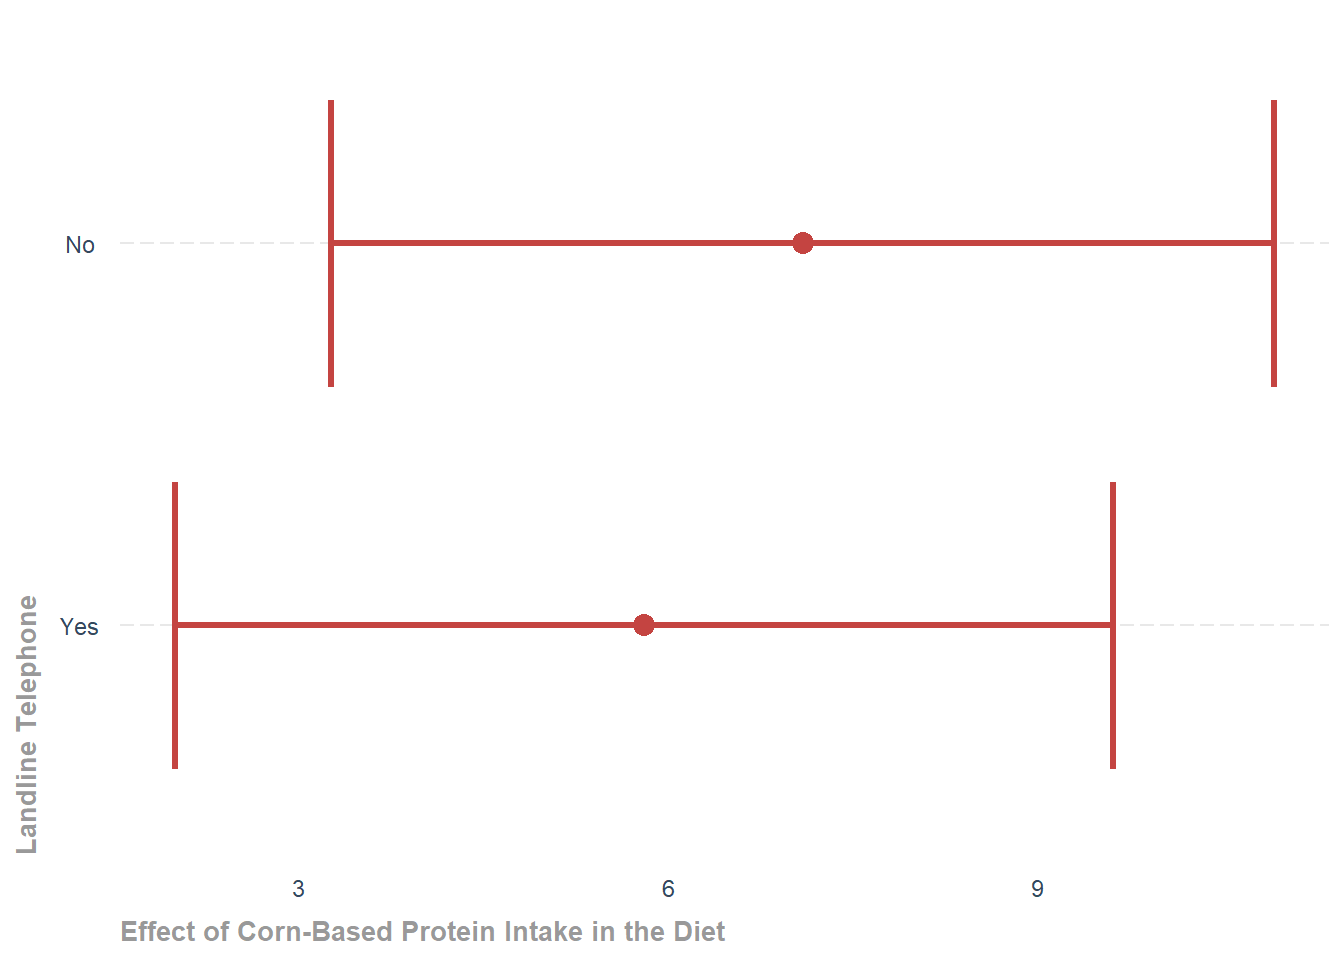
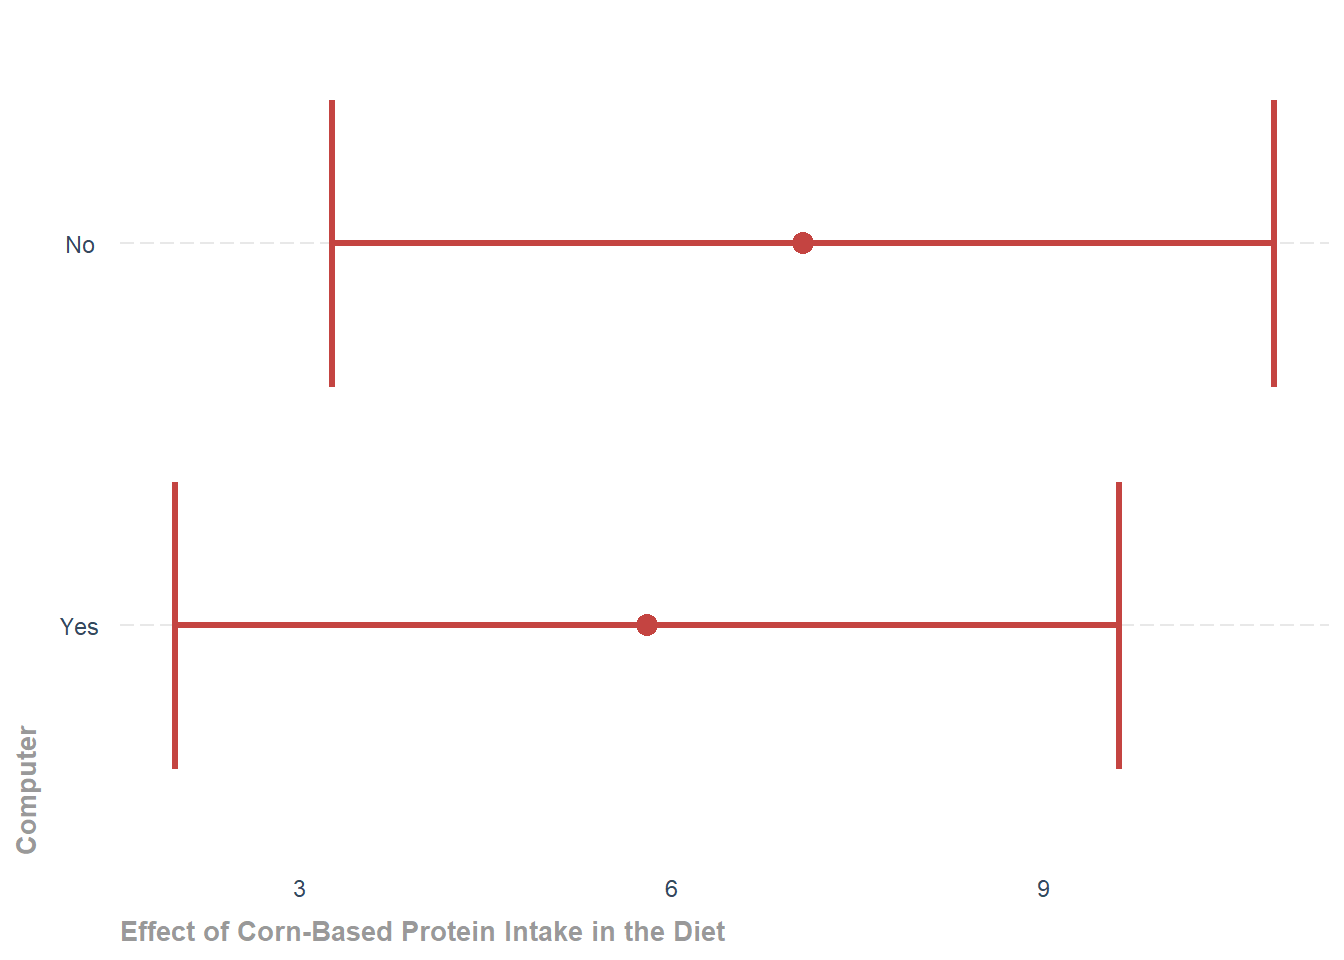
Effect charts are a useful tool for visualizing the relationship between an independent variable and a dependent variable in a regression model. In this case, they are used to illustrate the relationship between the independent variables and daily Protein intake (g/day) in the ENCOVI 2014 database. Specifically, they show how Protein intake changes with different values of the independent variable.
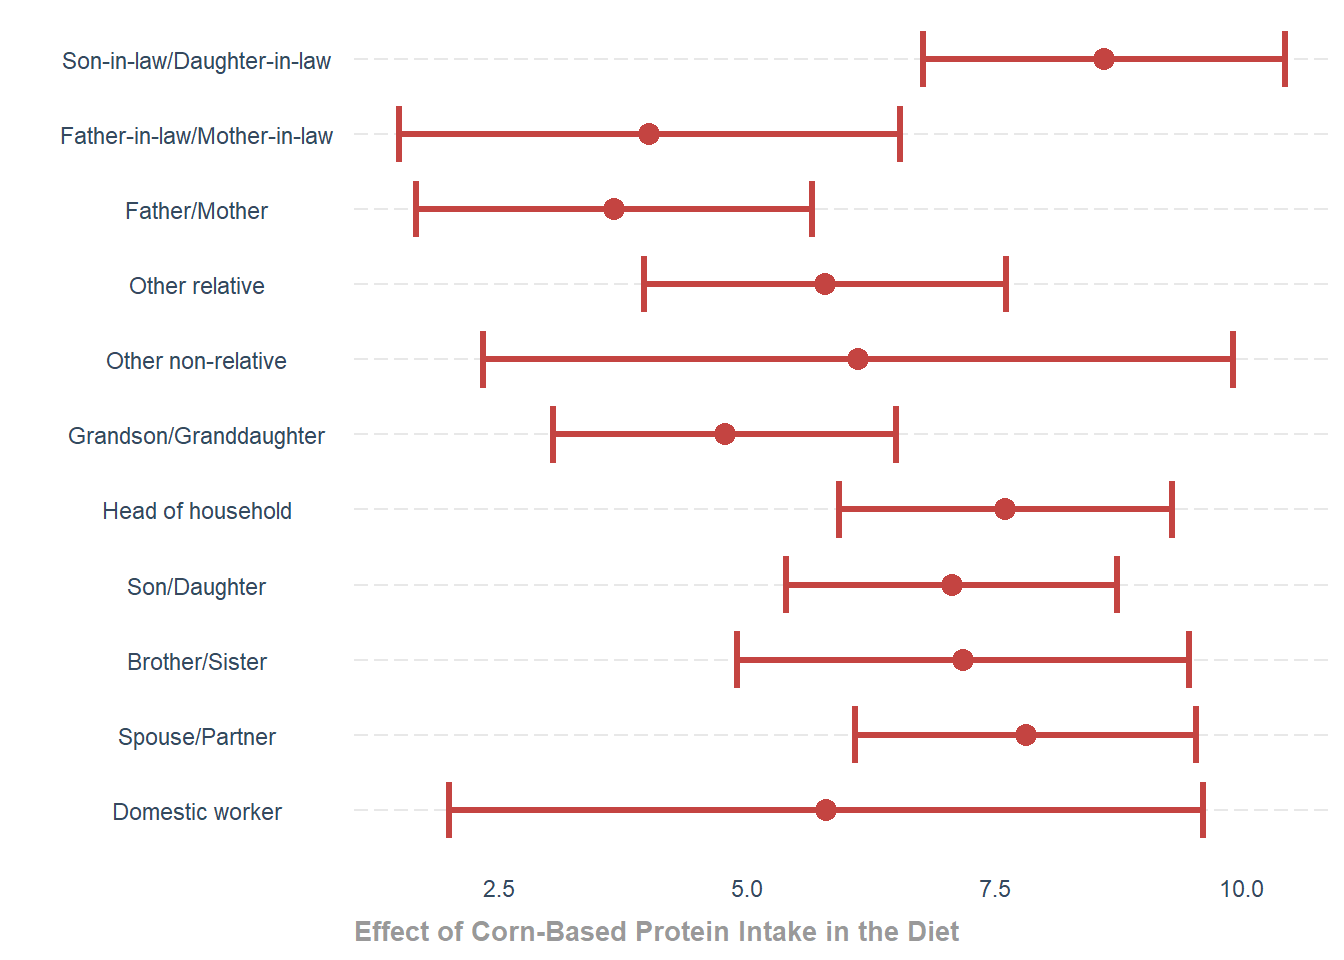
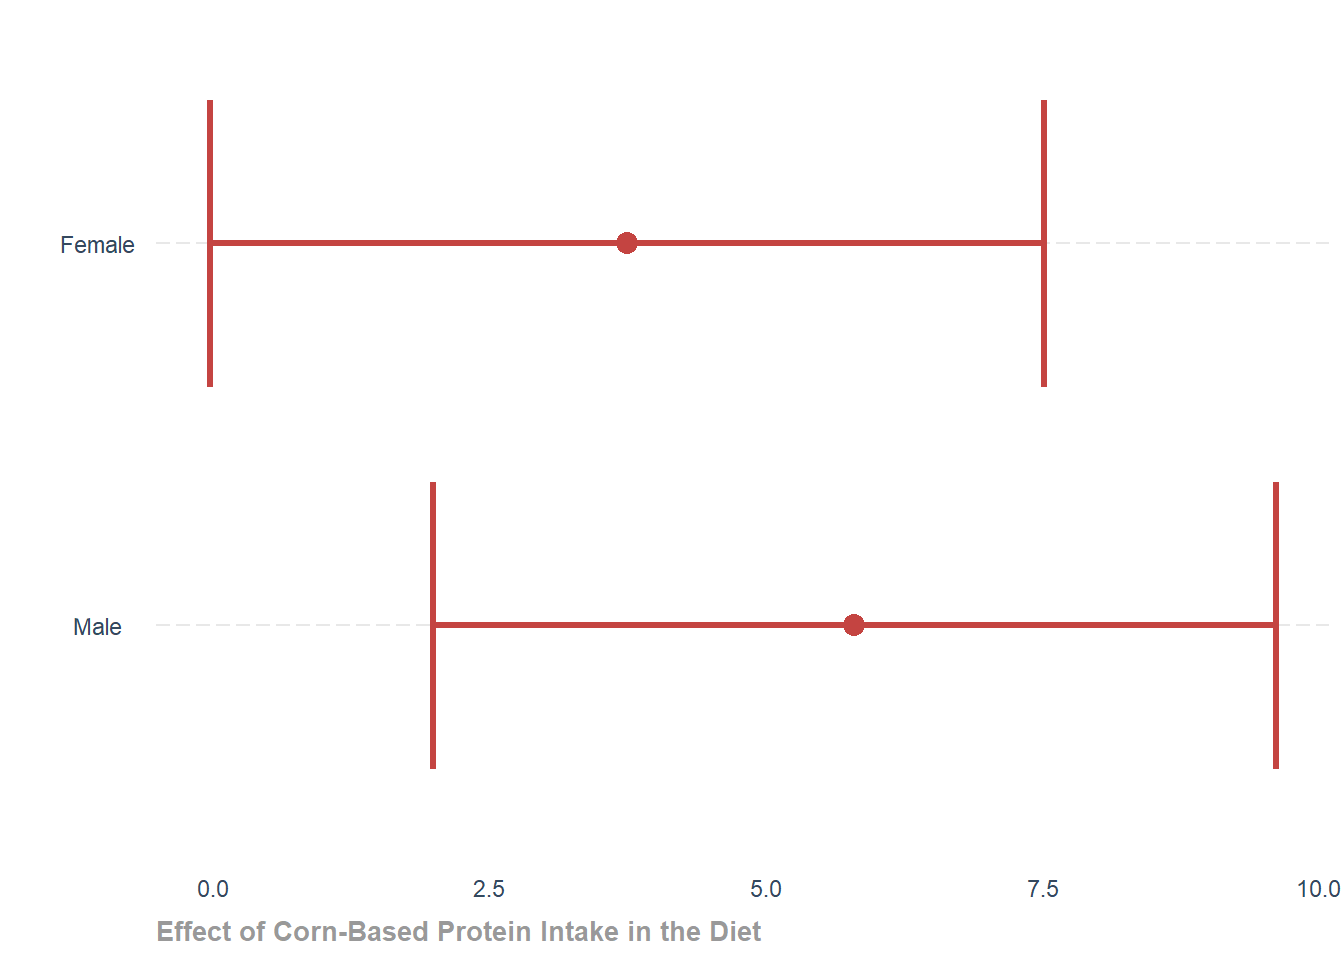
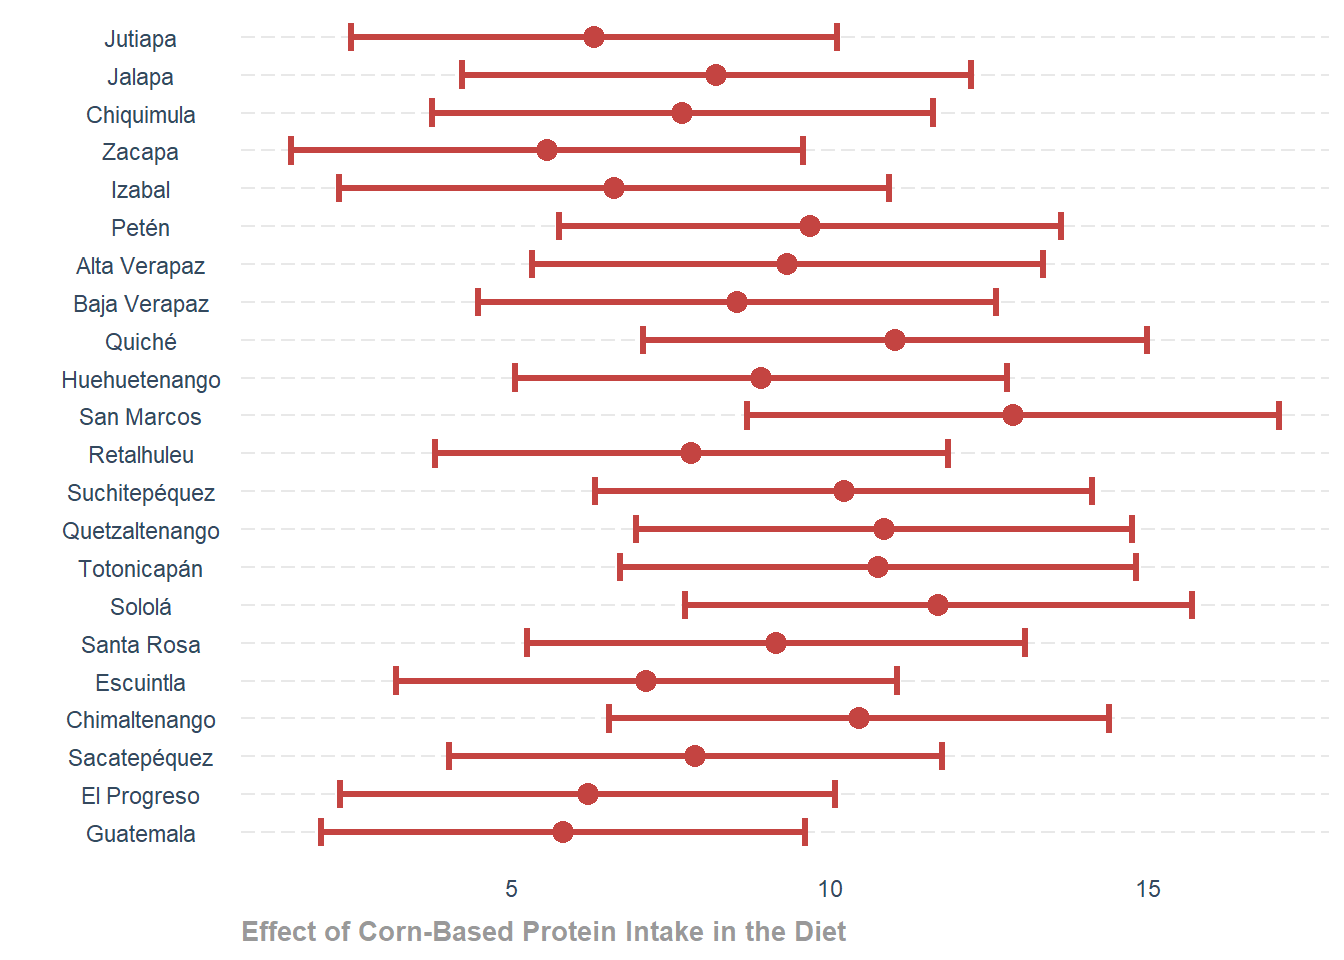
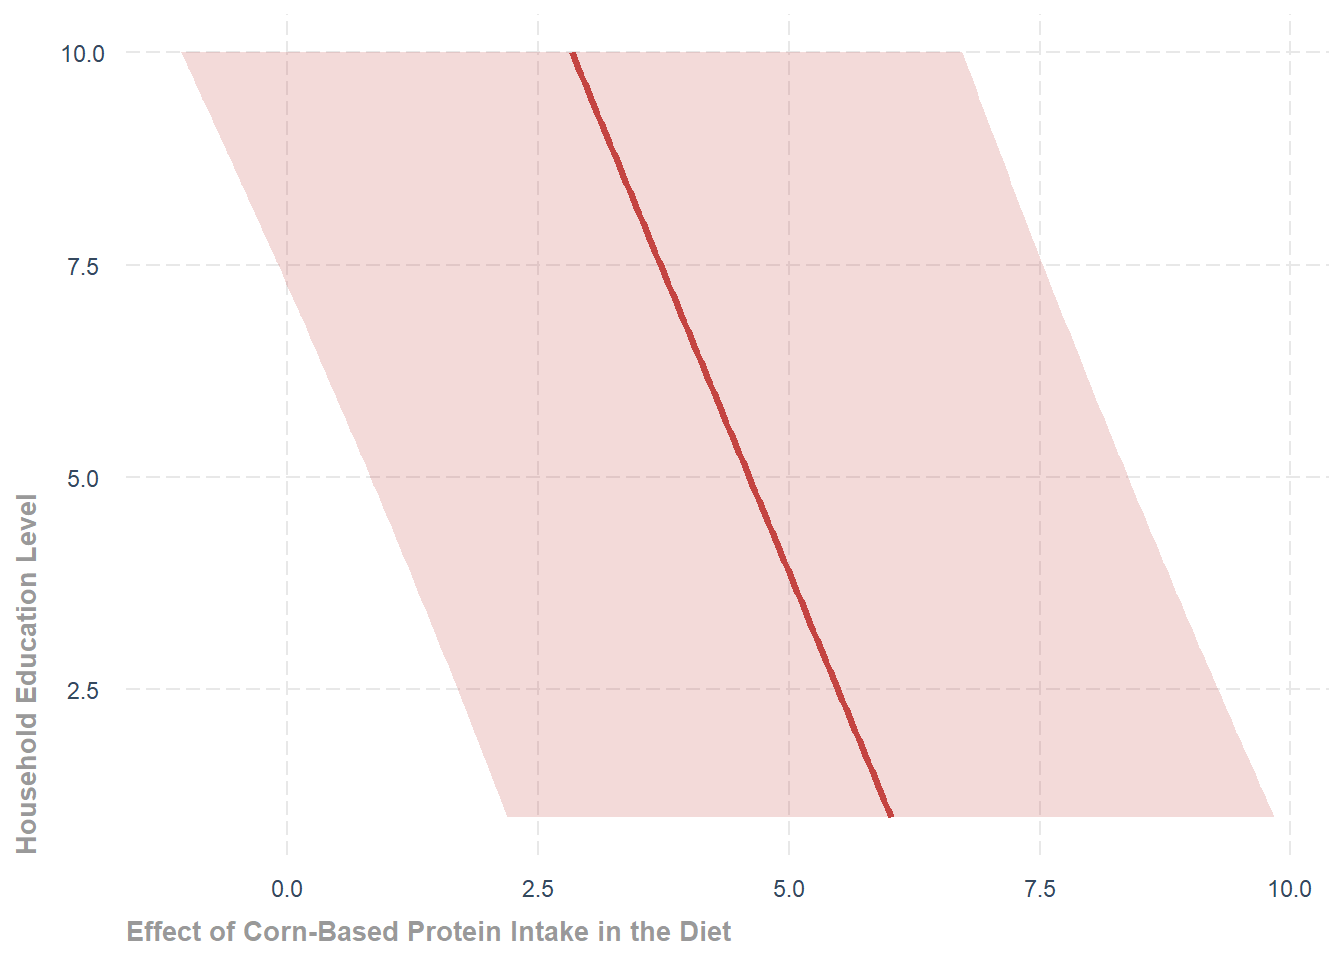
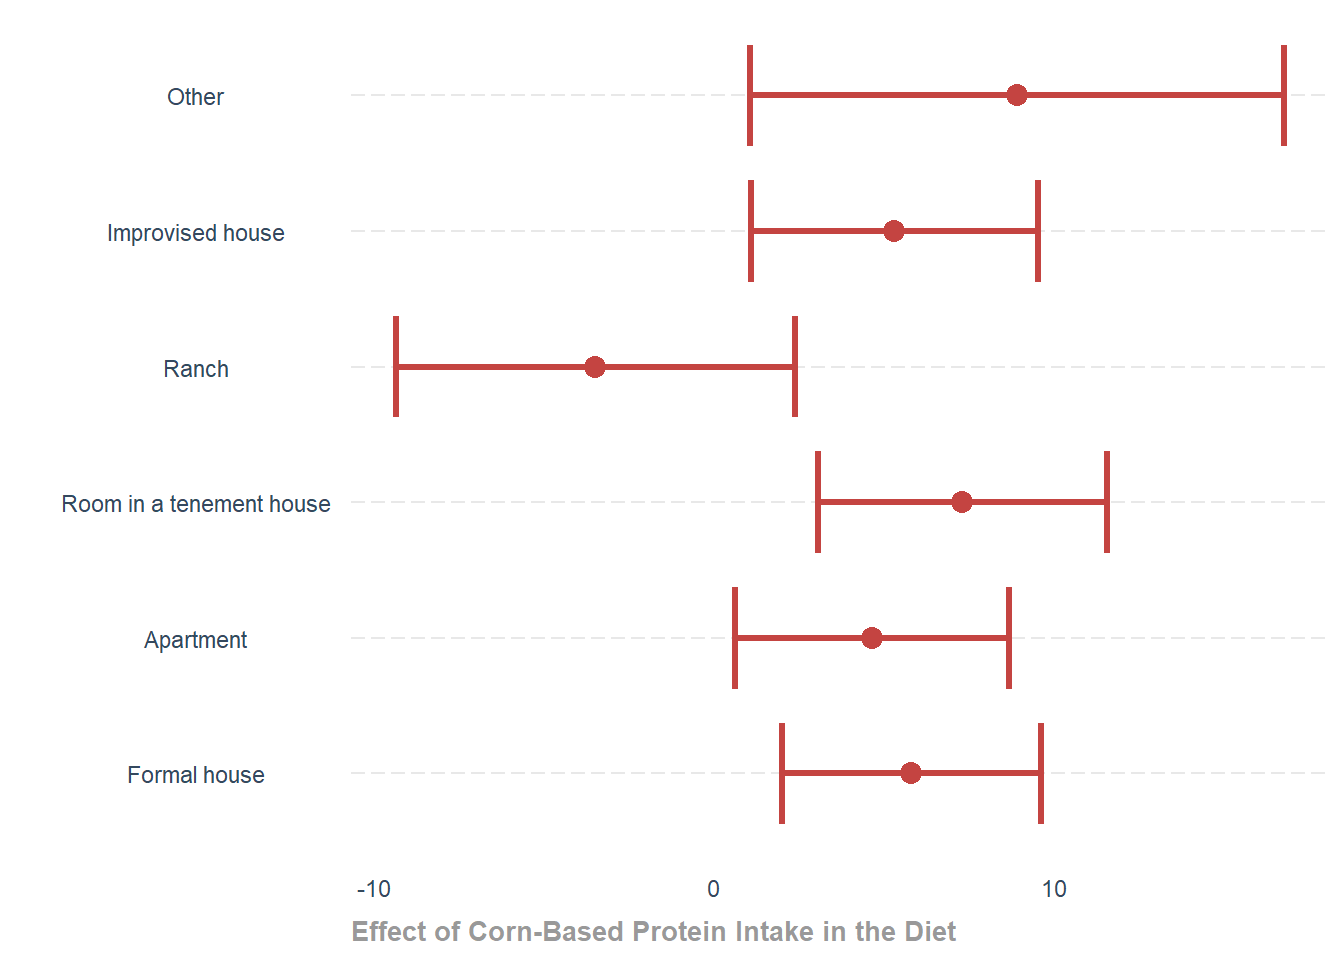
Effects of the Model for Protein Based on Corn Intake
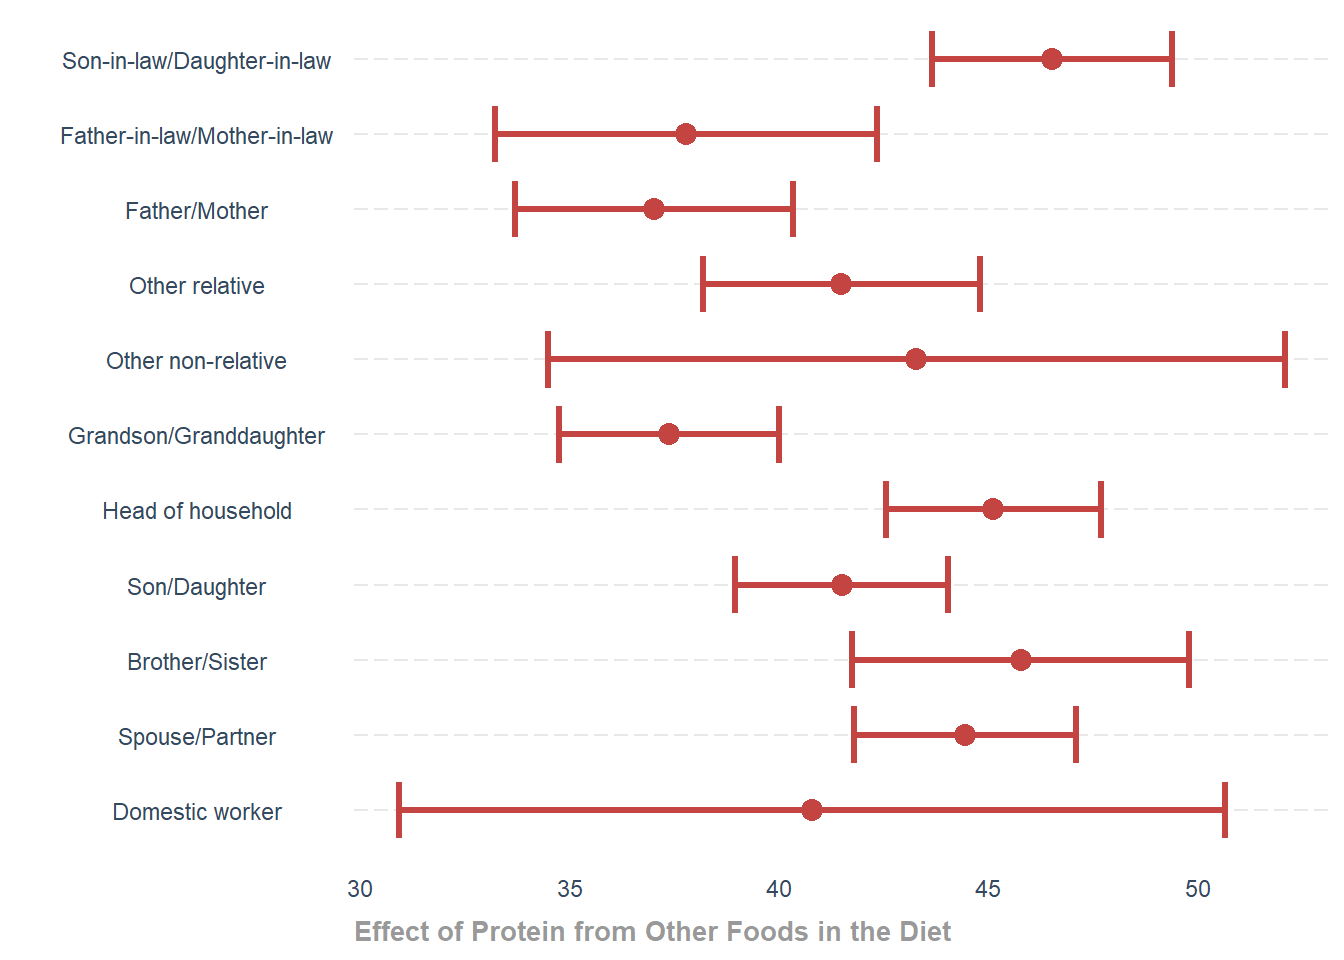
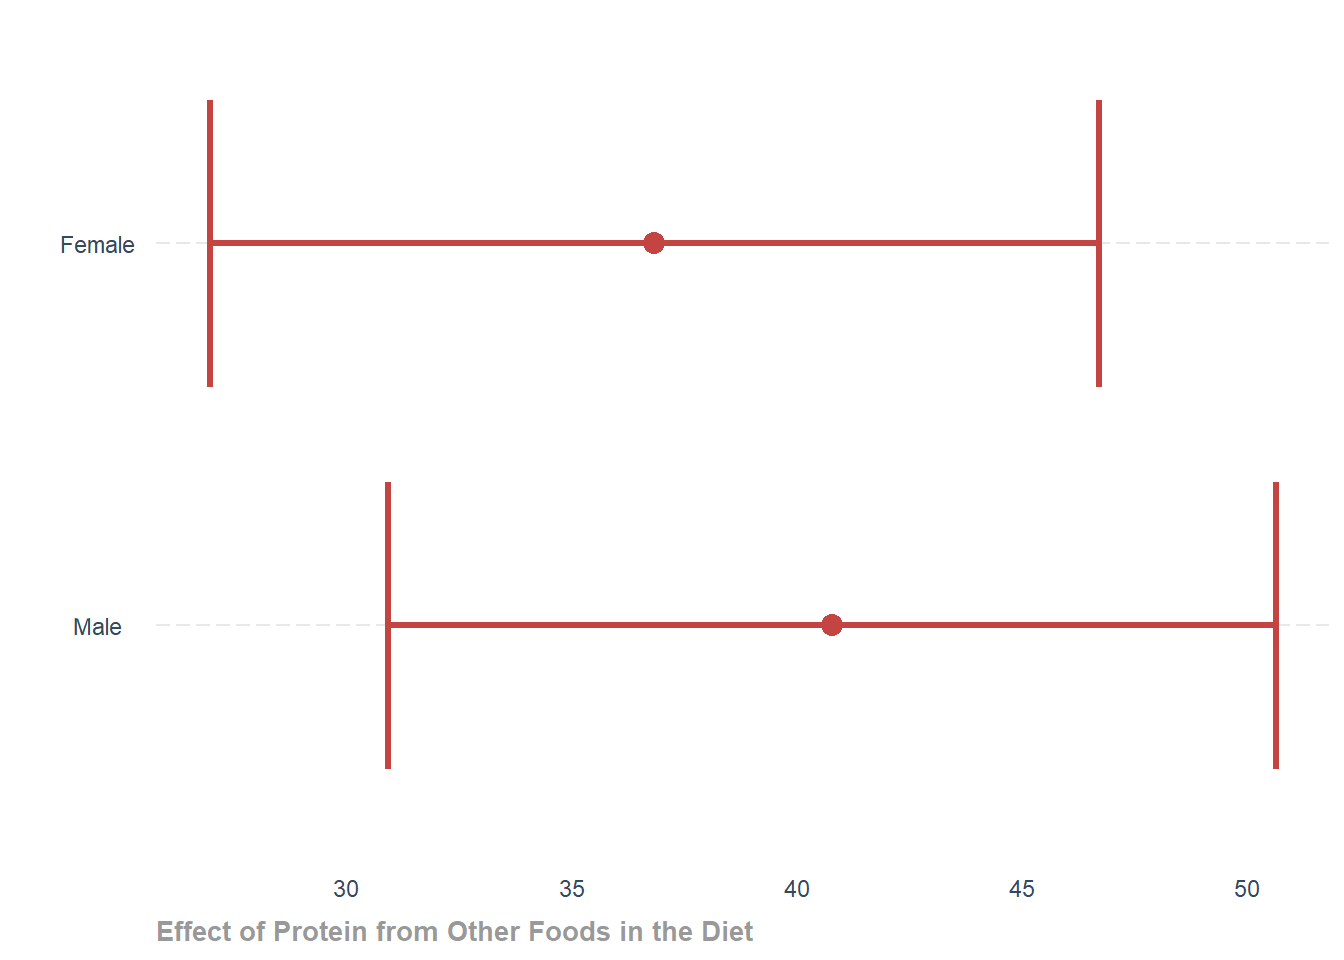
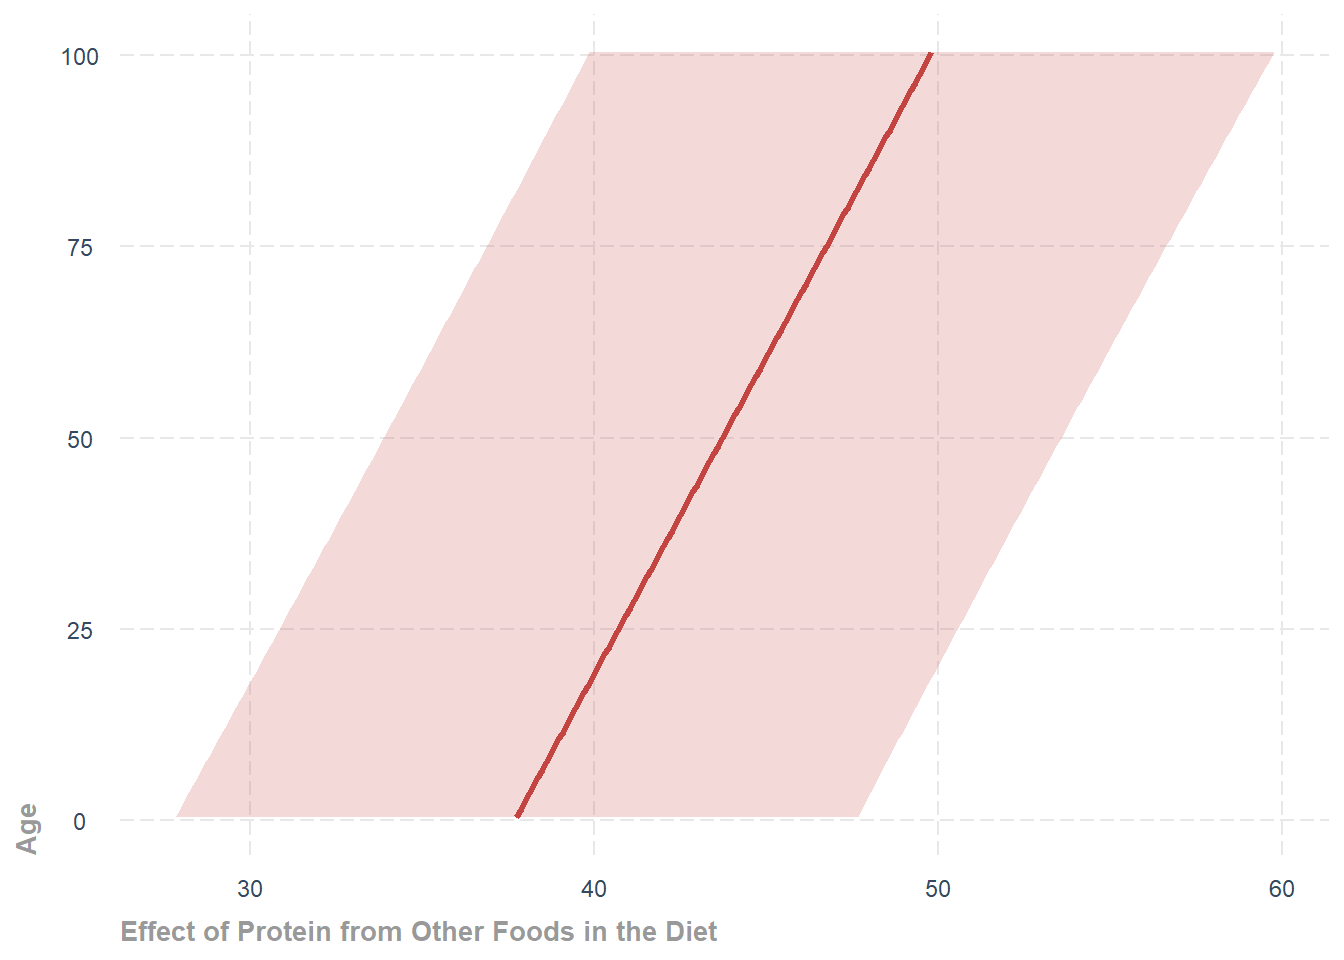
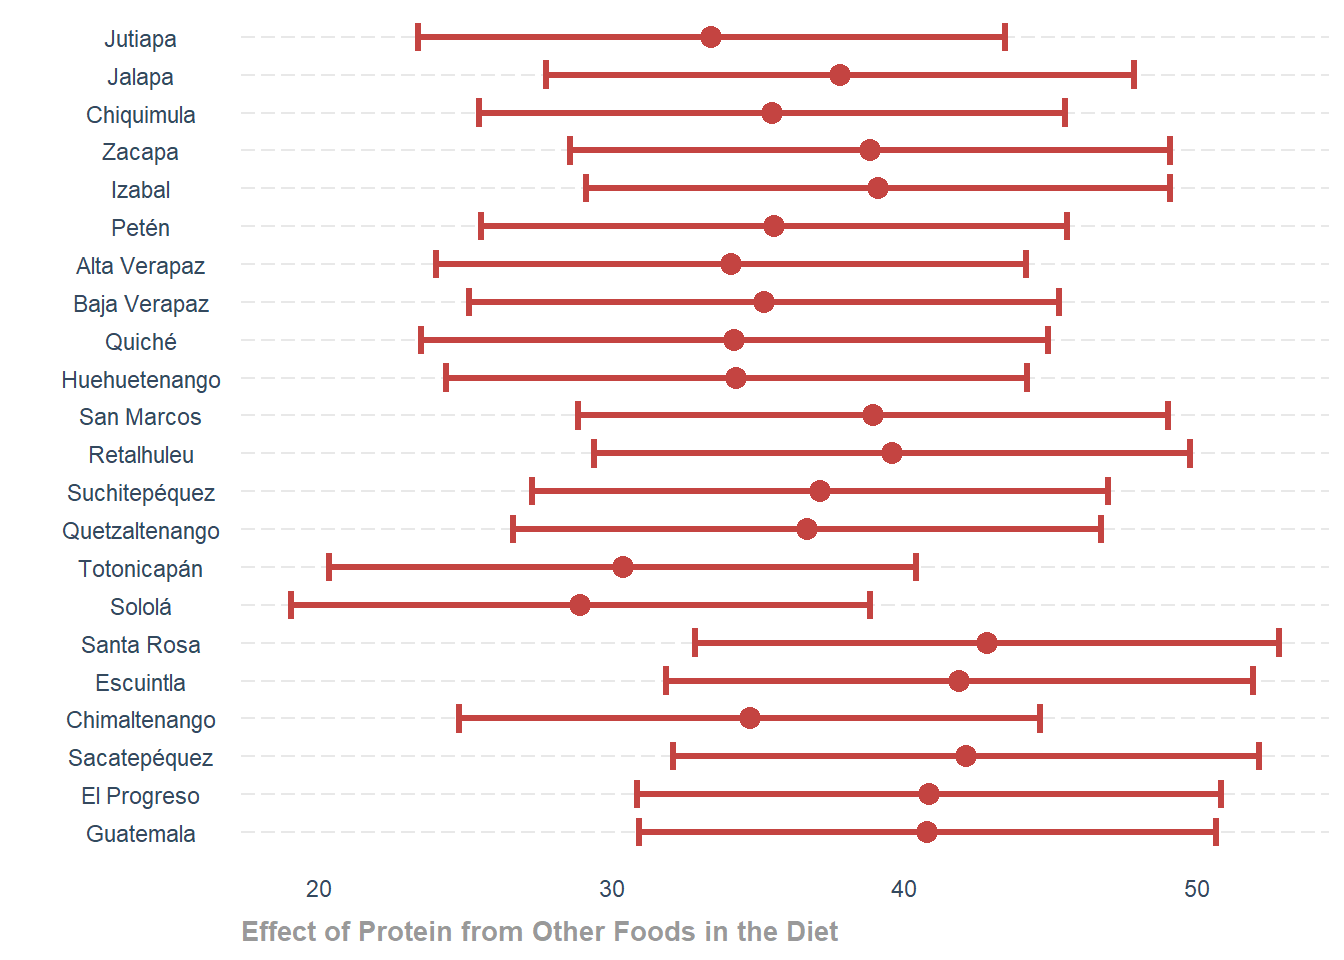
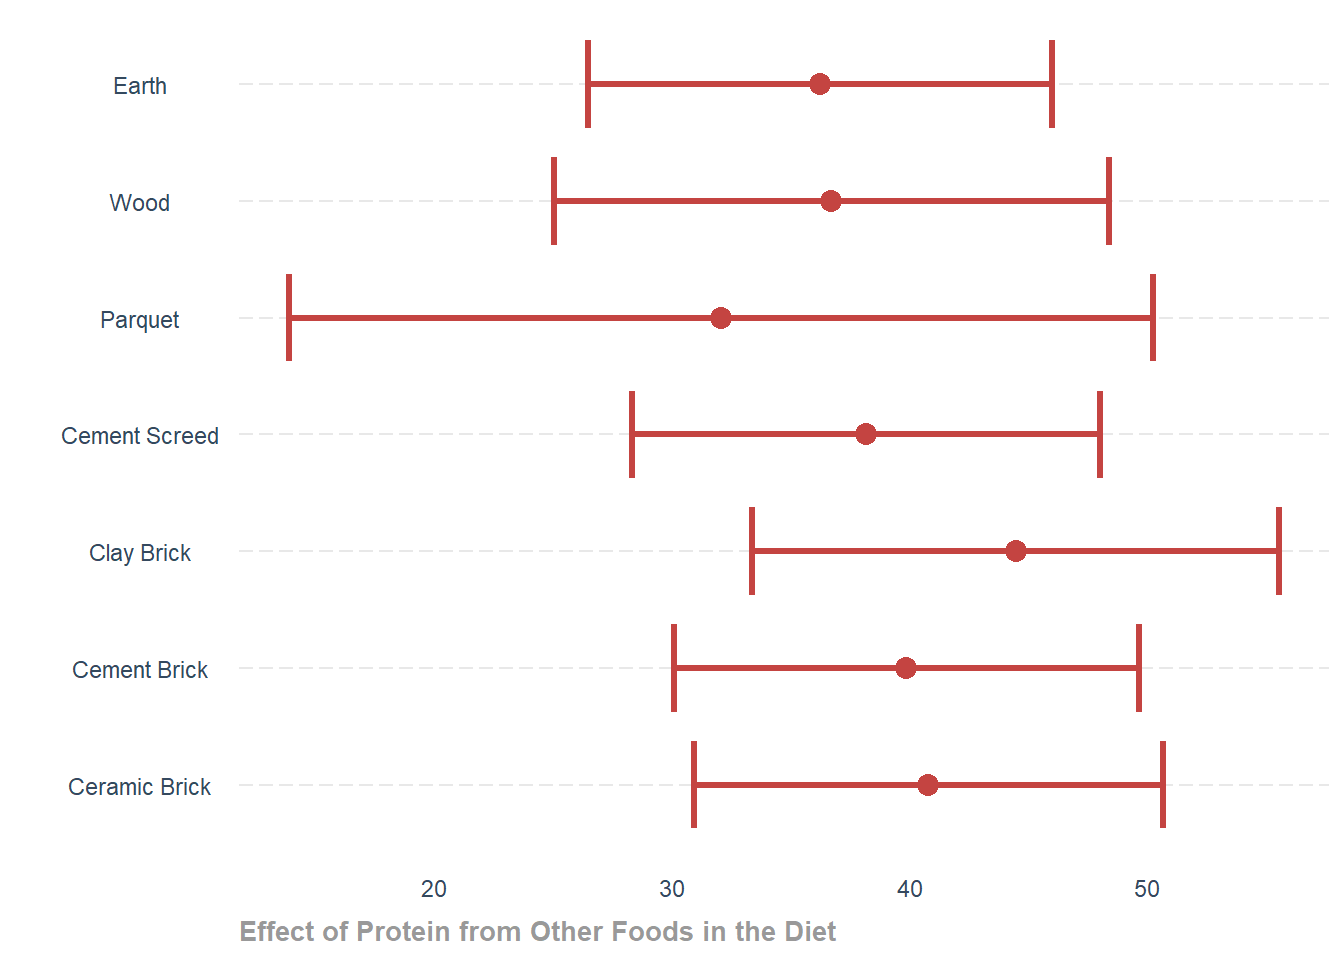
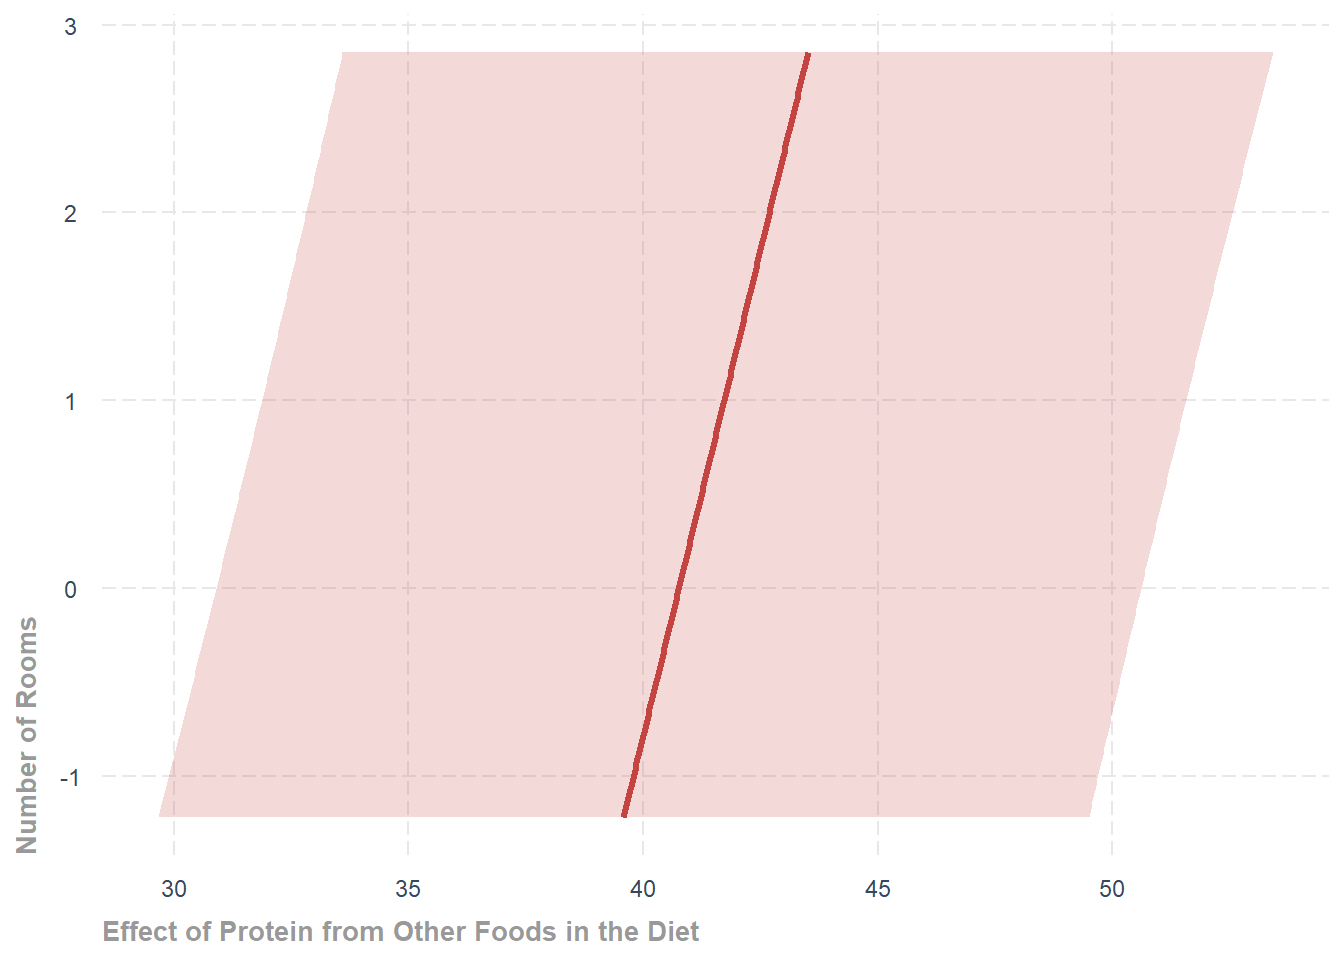
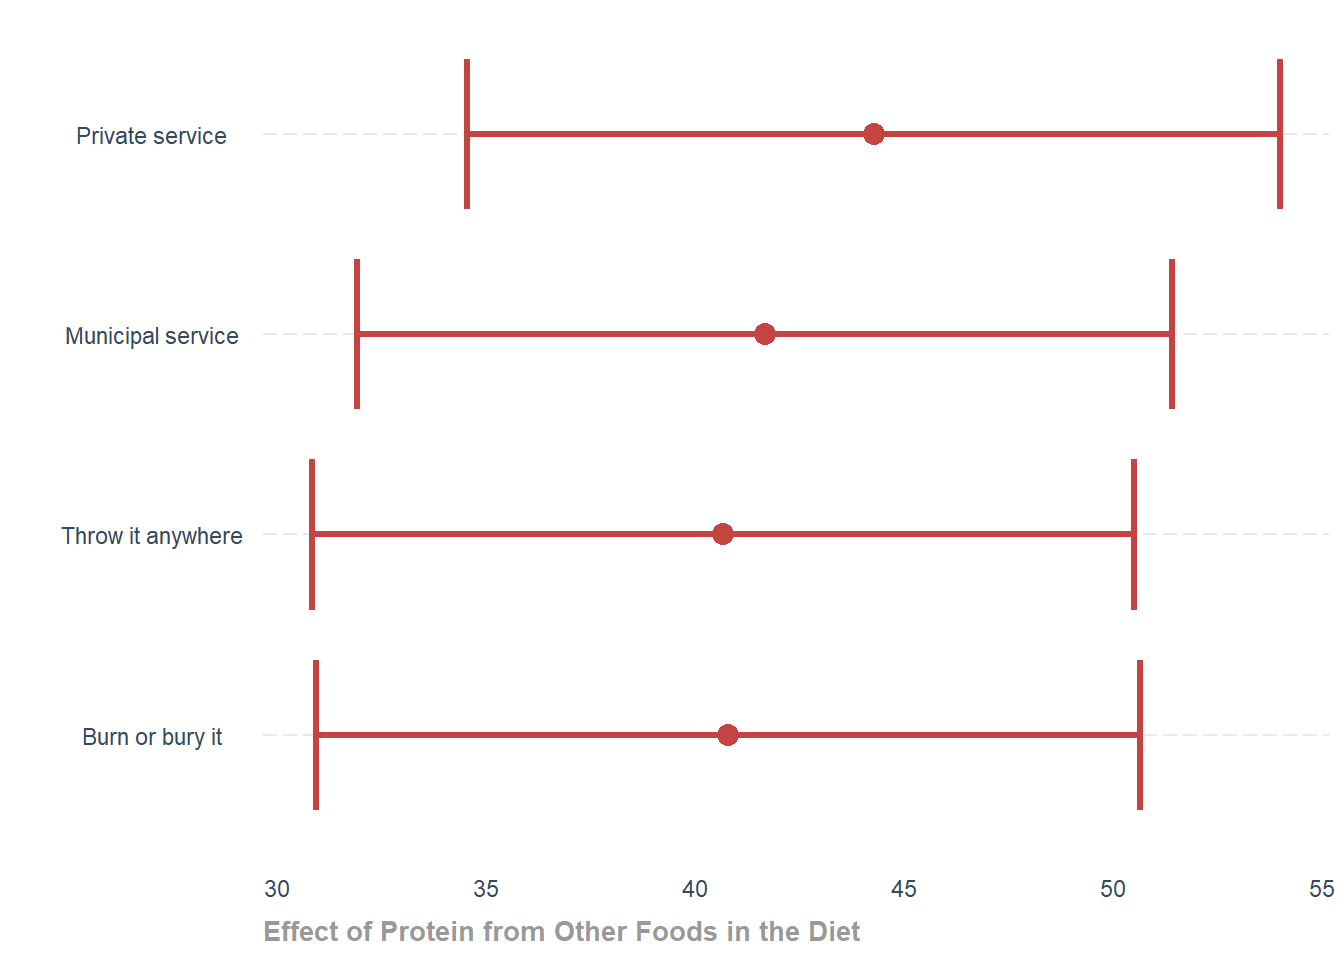
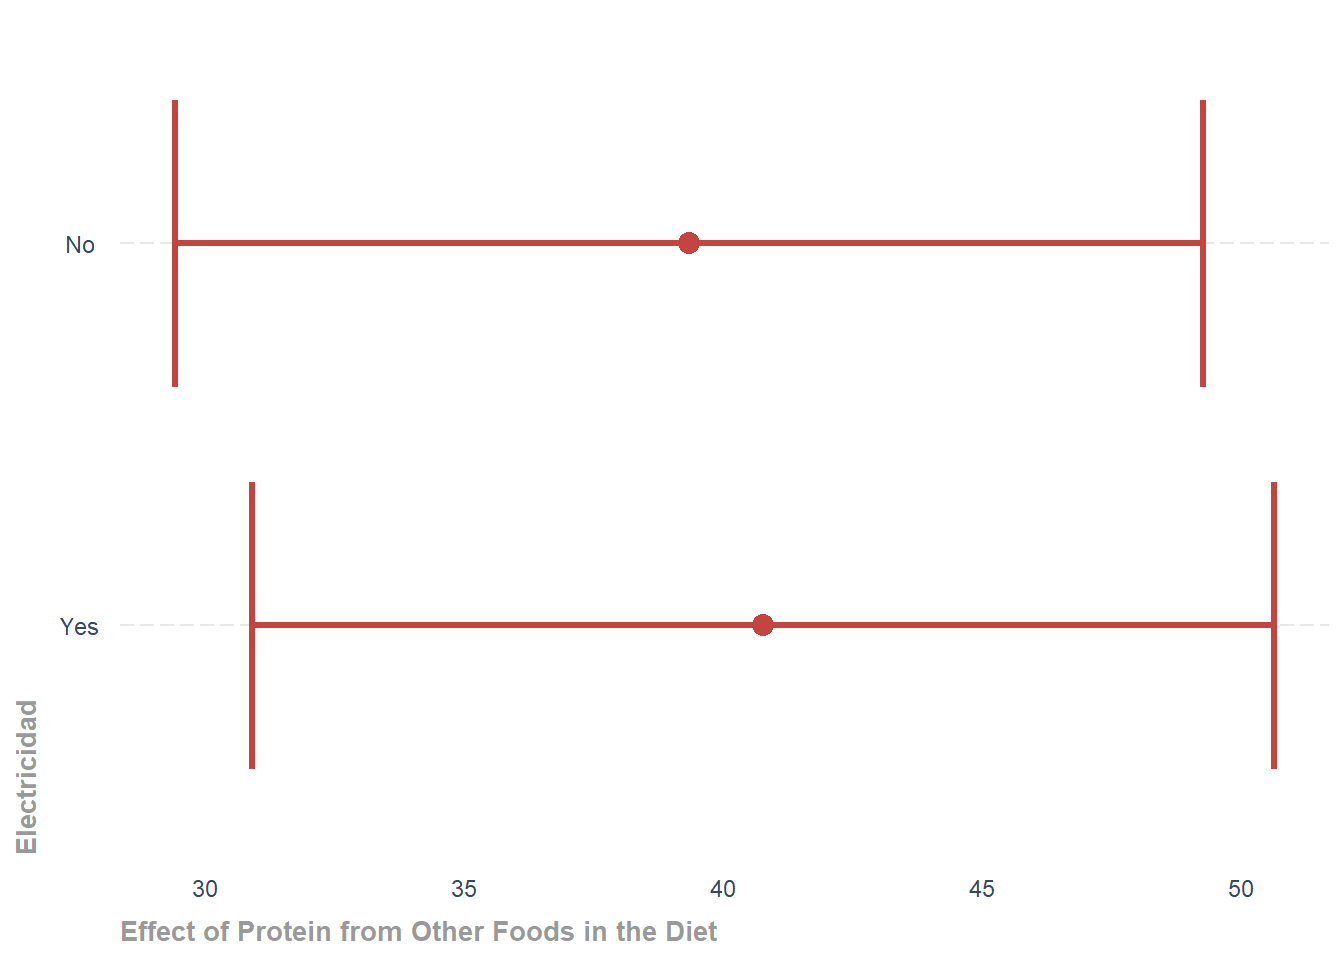
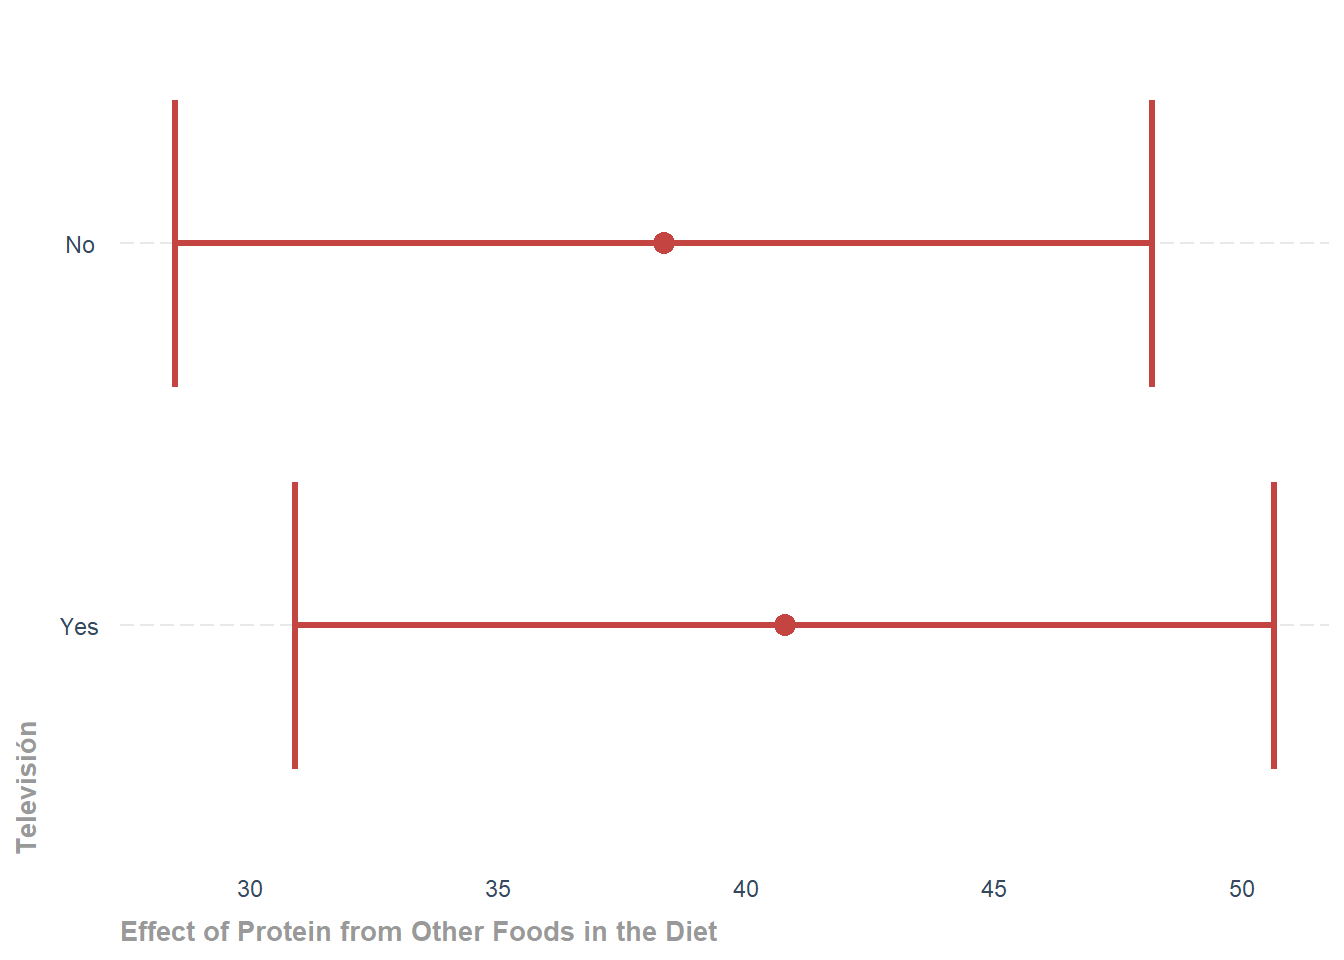
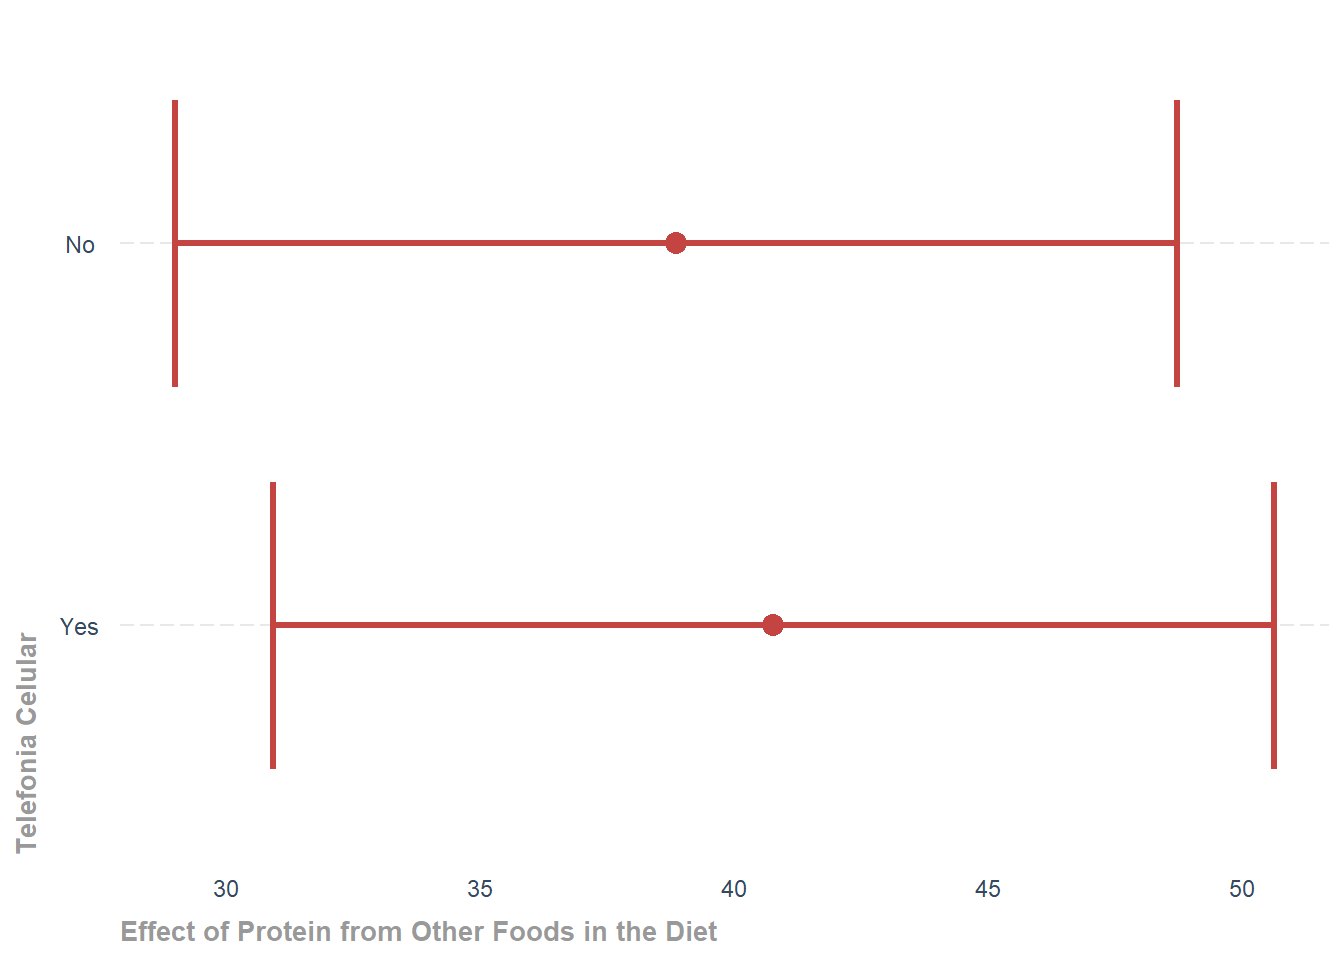
Effects of the Model for Protein Based on Intake of Other Foods (excluding Corn)