Effect Charts of Nutritional Variables on the Chronic Malnutrition Model
Effect charts for each logistic model of stunting with each of the nutritional variables introduced.
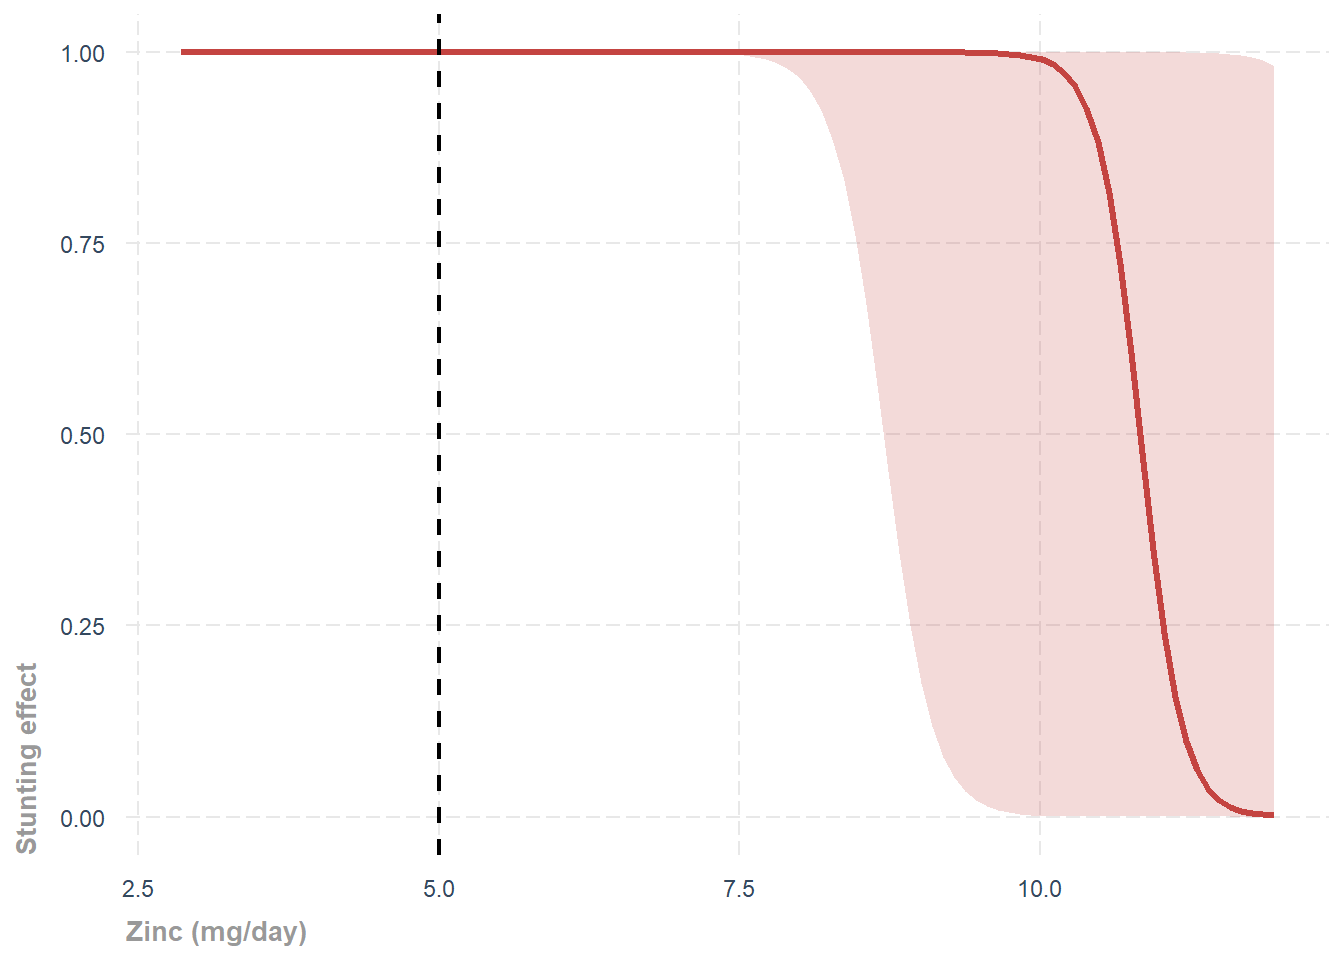
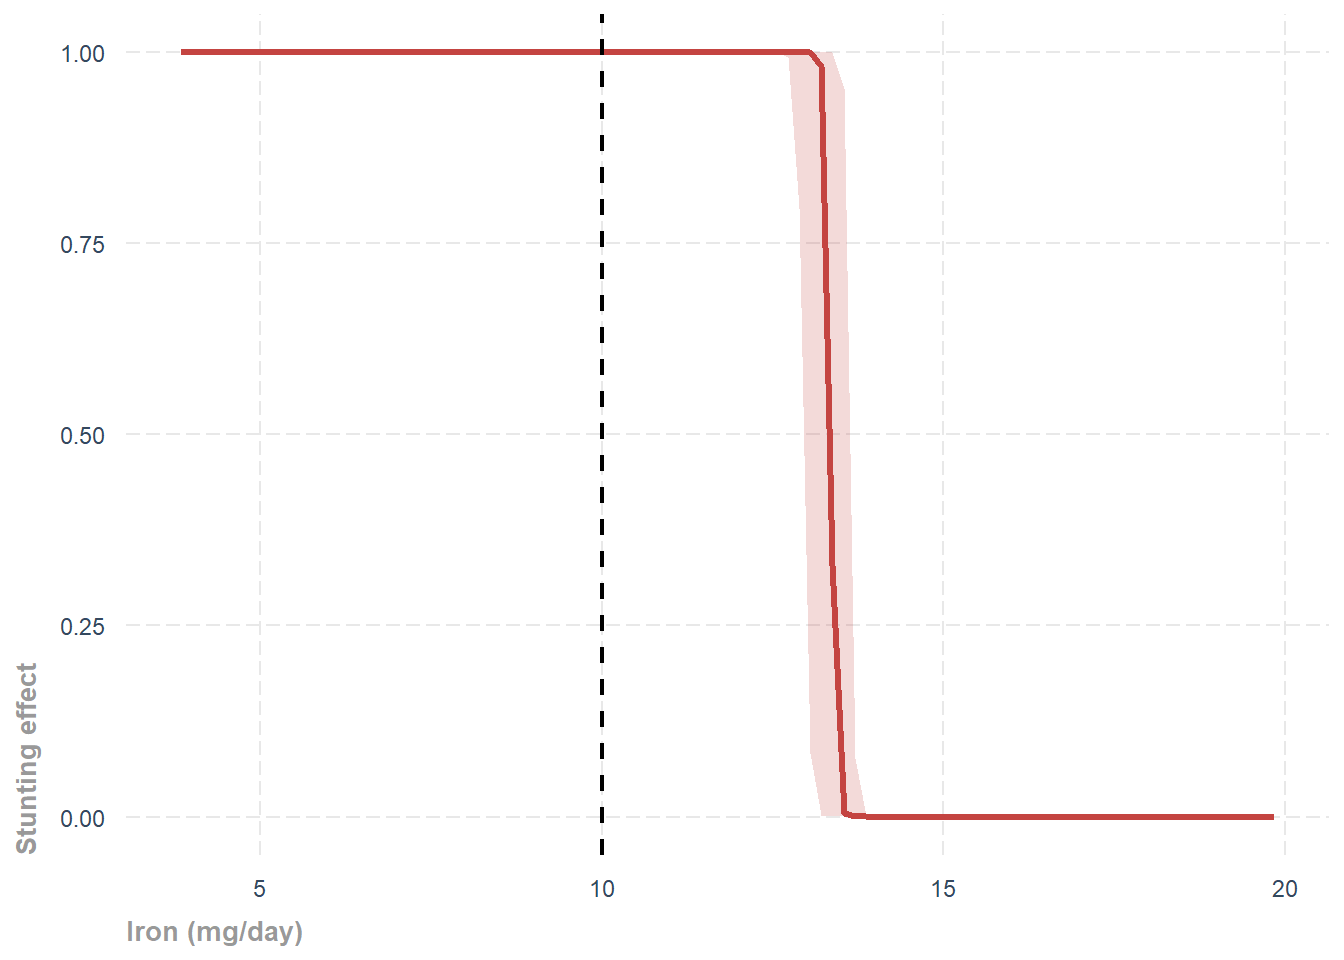
The effect charts in this section aim to show the increase or decrease in the probability of experiencing stunting (associated with value 1 in the chart) or not (associated with value 0 in the chart) based on daily intakes of Zinc and Iron, respectively.
Effect Chart for Zinc intake
Effect Chart for Iron intake
Effects Table of Disease Symptoms on Nutrition
Below is a table showing the observed effects in the model concerning the symptoms of diseases recorded in the SIVESNU database.
This effects table illustrates how the presence of these symptoms decreases the levels of Zinc or Iron in the studied child population, according to the percentages shown.
Observed symptom | Effect on absorbed zinc | Effect on absorbed iron |
|---|---|---|
Fiber | 13% | 50% |
Cough | 18% | 38% |
Diarrhea | 11% | 47% |