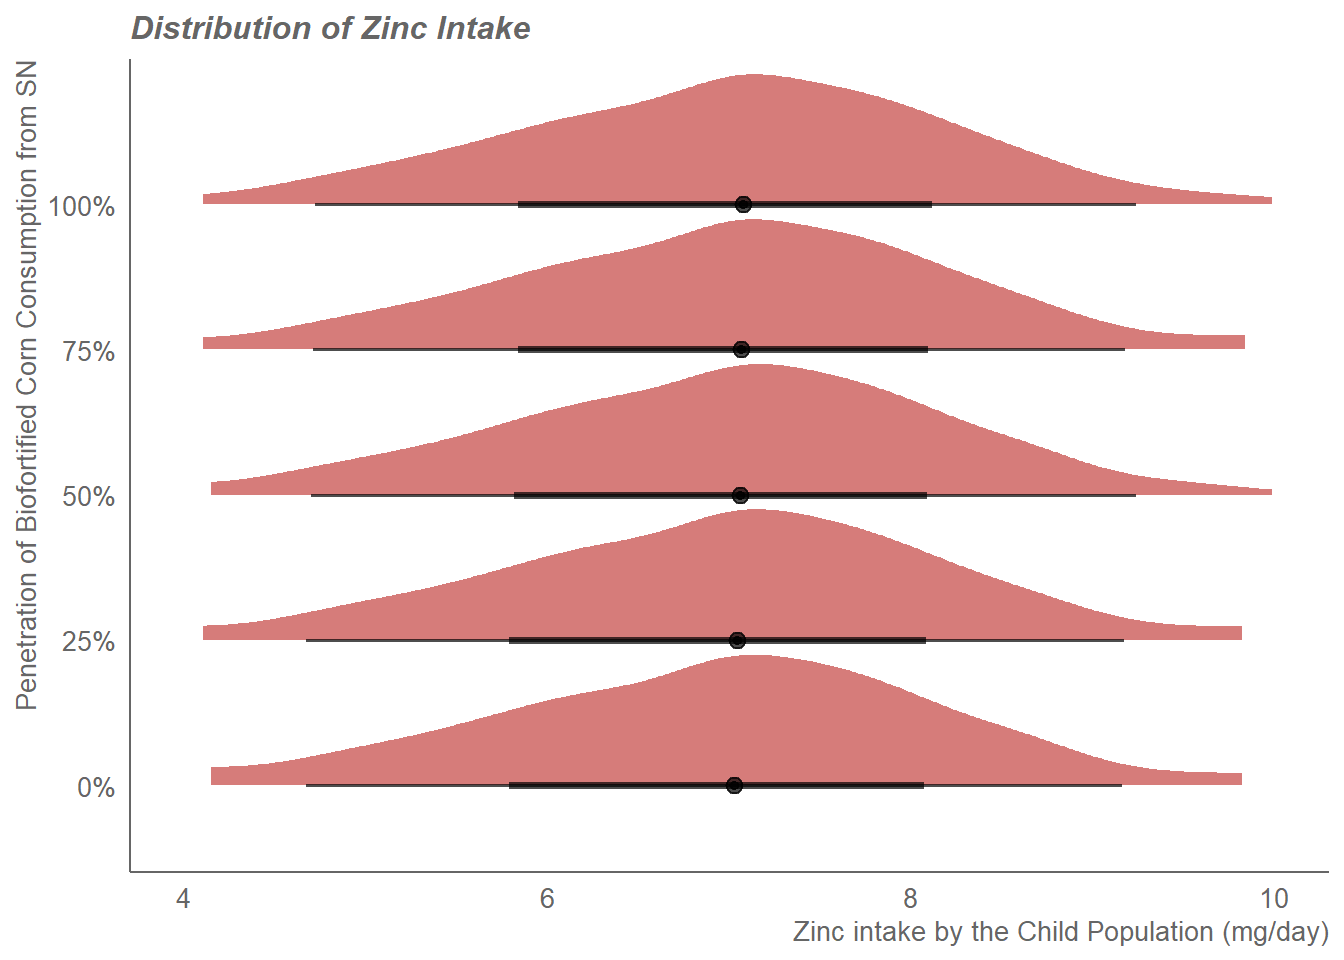
% Penetration | 0% | 25% | 50% | 75% | 100% |
|---|---|---|---|---|---|
Daily zinc intake (mg/day) | |||||
Median | 7.02 | 7.03 | 7.06 | 7.06 | 7.07 |
[IQR] | [6.12, 7.78] | [6.14, 7.78] | [6.15, 7.79] | [6.15, 7.82] | [6.17, 7.84] |
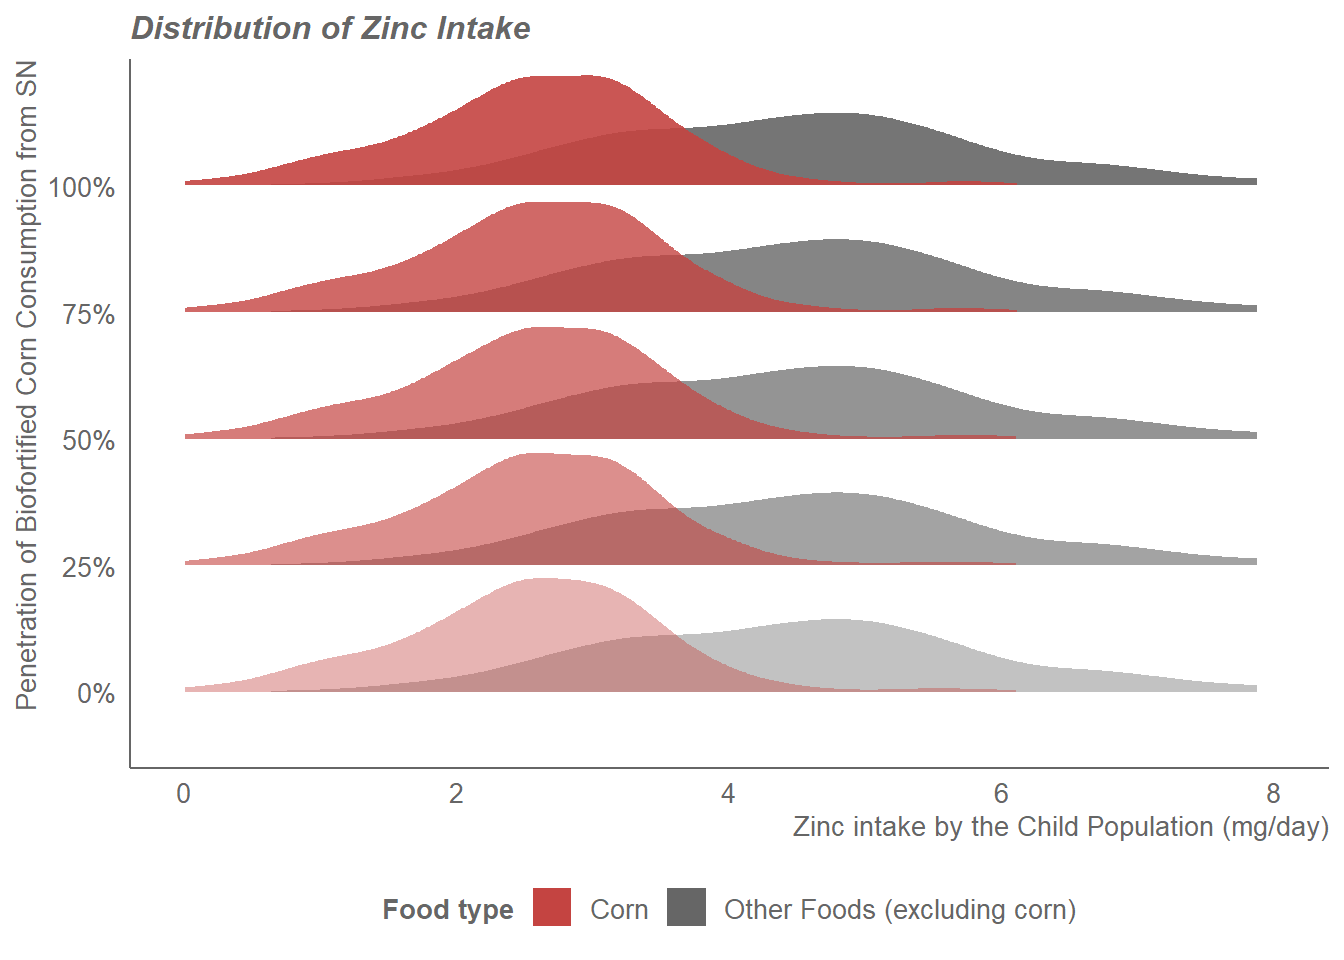
Variation in Consumption According to the Penetration of Biofortified Corn from SN
Below are graphs showing the variation in zinc and iron intake based on different levels of penetration of biofortified corn consumption from SN.
An increase in consumption has been considered uniformly across the entire child population. Additionally, bioavailability and disease factors have been taken into account for the population.
Variation in the Distribution of Daily Zinc Intake According to the Market Penetration of Biofortified Corn from SN
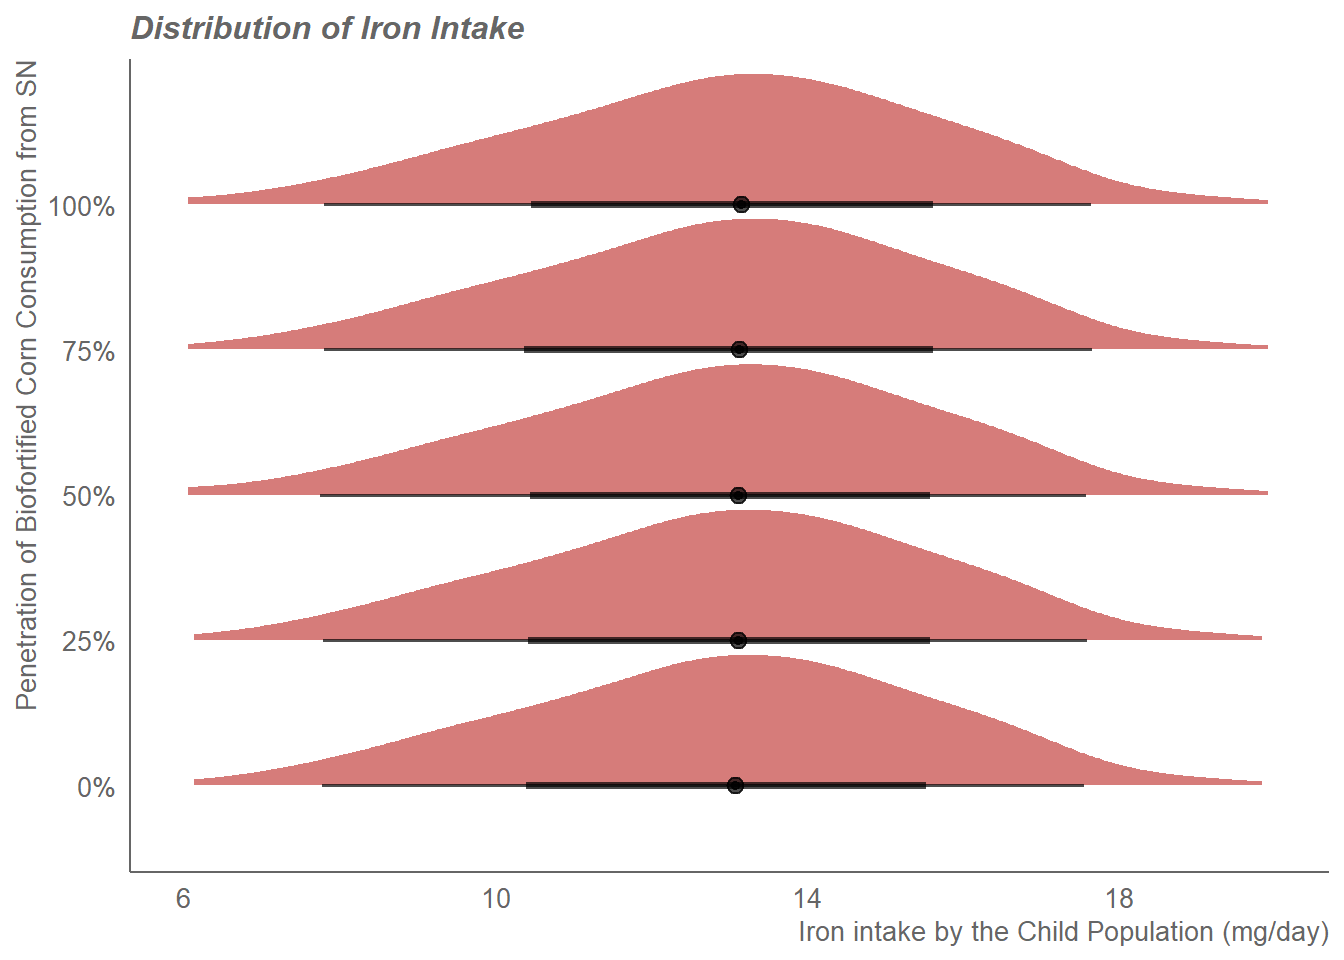
Variation in the Distribution of Daily Iron Intake According to the Market Penetration of Biofortified Corn from SN
% Penetration | 0% | 25% | 50% | 75% | 100% |
|---|---|---|---|---|---|
Daily iron intake (mg/day) | |||||
Median | 12.75 | 12.77 | 12.77 | 12.78 | 12.85 |
[IQR] | [10.79, 14.49] | [10.80, 14.52] | [10.82, 14.50] | [10.82, 14.53] | [10.83, 14.56] |