Methodology Used in the Analysis of Chronic Malnutrition in Guatemala
This section provides a brief description of the methodology used in the analysis of chronic malnutrition in Guatemala.
Flow Diagram
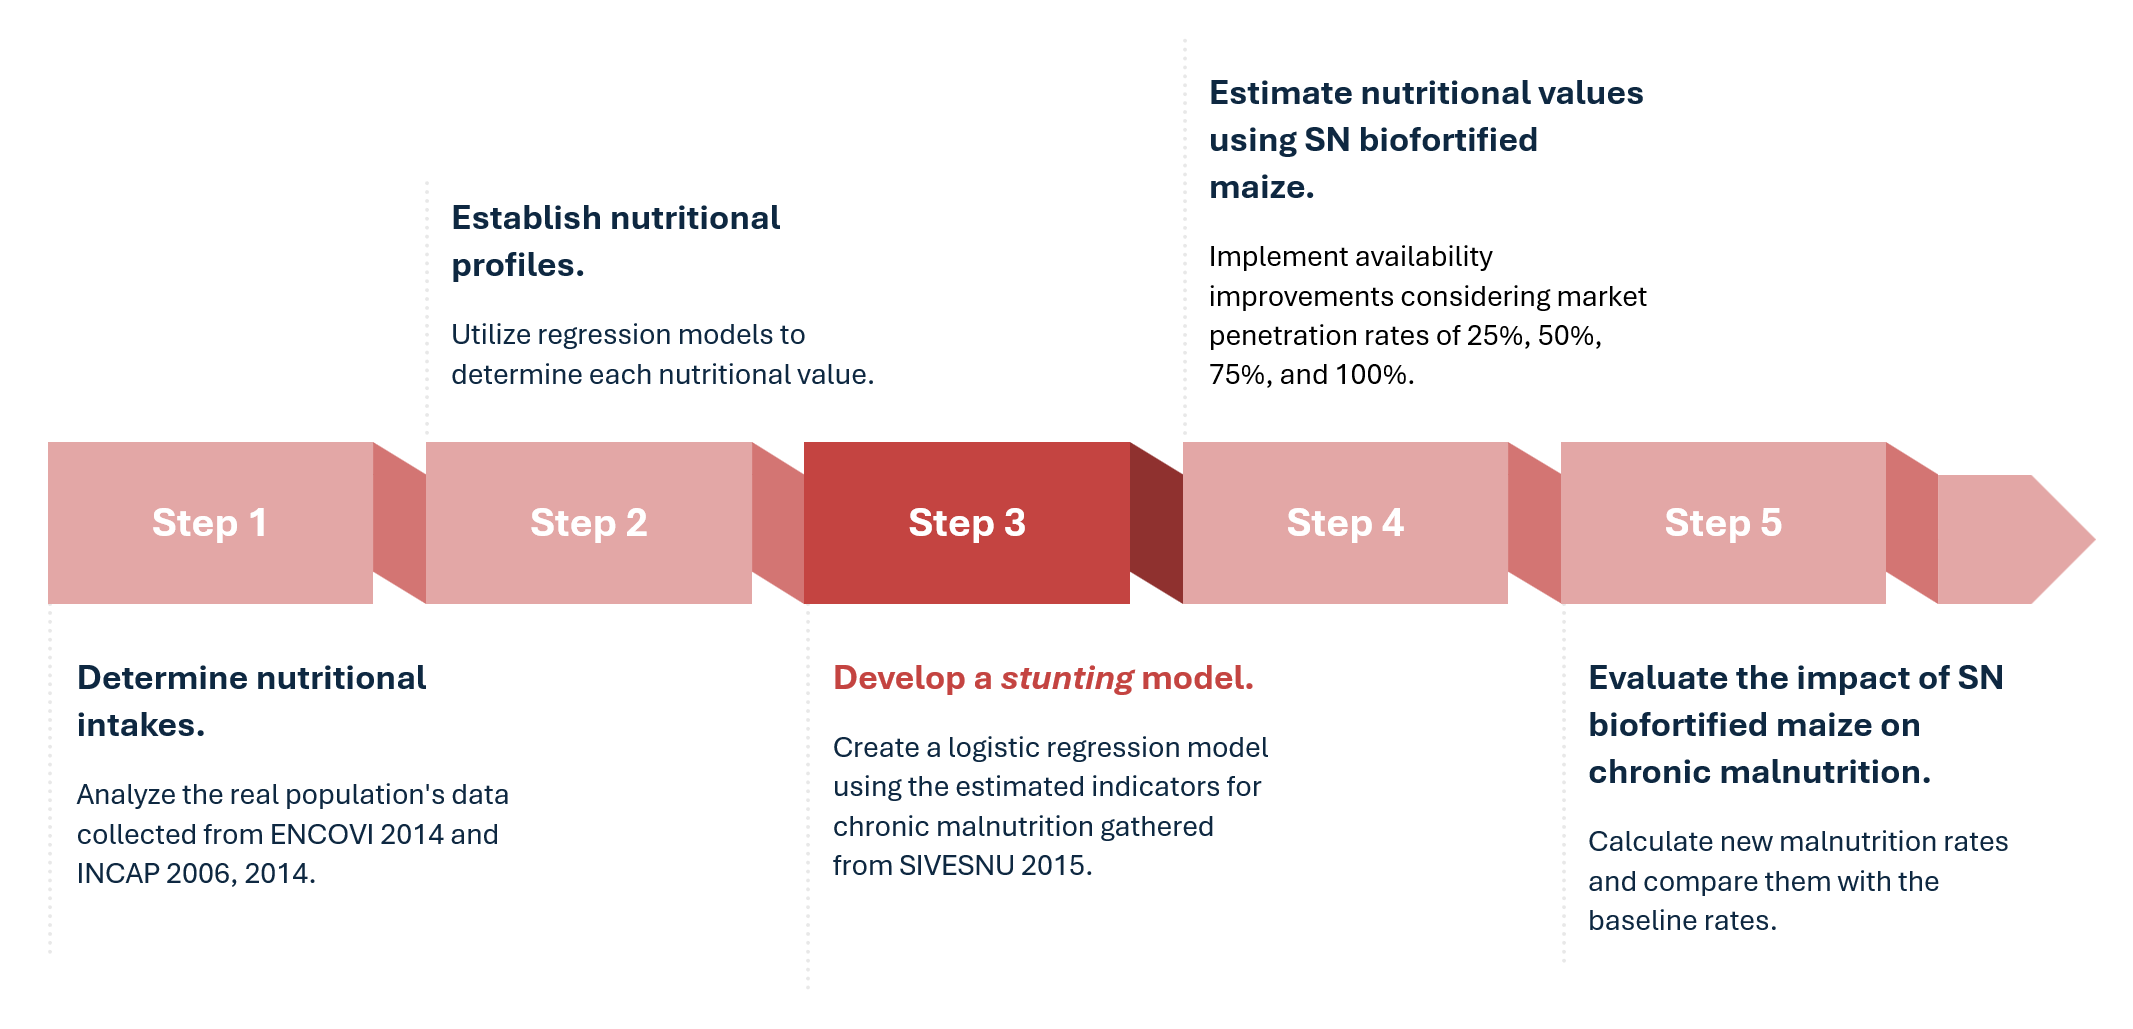
Methodology Description
Step 1: Determination of Nutritional Intakes
Household food consumption is determined using data collected from the ENCOVI 2014 database.
Nutritional values for iron, zinc, and proteins are derived from INCAP 2014 data. Values for the amino acids lysine and tryptophan come from INCAP 2006 data.
Individual nutritional values for iron, zinc, proteins, lysine, and tryptophan are determined from the data in point 1, household member records from the ENCOVI 2014 database, the Adult Male Equivalent (AME) conversion factor, and the bioavailability of nutrients based on the individual’s plant-based dietary profile.
Step 2: Establishment of Profiles
For each nutritional value (iron, zinc, proteins, lysine, and tryptophan) in the ENCOVI 2014 database, a consumption profile is established based on household socioeconomic characteristics.
Relevant factors in the intake of nutritional values are determined among the available ones: Department, Urban area, Number of household members, Property ownership, Construction materials, Type of housing, Housing characteristics, Water source, Waste management, Household assets, Family composition, Demographic data of individuals, and Education level.
Analyzing the collinearity of variables and evaluating the creation of synthetic variables to group factors as needed. These variables are available in both the ENCOVI 2014 and SIVESNU 2015 databases, facilitating the transfer of information between the two datasets.
Establishment of generalized linear regression models: two for each nutritional value (one for maize intakes and another for other foods), with predictor variables determined from the previous section. These models are trained with data available in the ENCOVI 2014 database.
Necessary normalizations, one-hot encodings, and variable transformations are performed according to the Yeo-Johnson methodology.
Application of regression models to the SIVESNU 2015 database to estimate the nutritional values in this database.
Verification of the distributions of the five predicted variables between the ENCOVI 2014 and SIVESNU 2015 databases to ensure accurate information transfer across the Guatemalan population based on population data from both databases.
Step 3: Generation of the Stunting Model
Using sociodemographic data and the vaccination profile of children from the SIVESNU 2015 database, and the variables estimated in the previous section, two regression models are generated to determine chronic malnutrition. The model outcomes are:
HFA (Height-for-age z-score categories). A dichotomous variable indicating Yes/No for chronic malnutrition.
ZLEN (Height-for-age z-score calculated based on WHO standards). A numerical variable for determining chronic malnutrition, with -2 as the cutoff point for defining the presence of chronic malnutrition.
A generalized linear regression model is trained for the ZLEN variable and a logistic regression model for the HFA variable. In both cases, predictor variables are obtained from the estimated nutritional values and socioeconomic indicators, demographic variables, and the children’s immunological profile variables.
Step 4: Estimation of Nutritional Values with SN Biofortified Maize Penetration
Application of improvements in nutritional availability assuming different levels of penetration in population consumption of SN biofortified maize (penetration levels of 25%, 50%, and 100%).
Determination of new iron and zinc variables from different consumption penetration levels. This process is performed based on ENCOVI 2014 consumption data and estimated in SIVESNU 2015 through the linear regression models generated in section 2.
Corrections in the estimation of penetration levels are made based on two factors:
Presence of disease symptoms (diarrhea, cough, or fever) in infants. Establishing the effects of these symptoms on the population from SIVESNU 2015 data and the nutritional values estimated in section 2.
Nutrient bioavailability based on the type of plant-based diet.
Step 5: Evaluation of the Impact of SN Biofortified Maize on Chronic Malnutrition
Application of the estimated nutritional variables for different penetration levels to the Stunting models. This determines new malnutrition levels based on different consumption penetration levels.
Presentation of results in tabular and graphical formats for better comprehension of the conclusions drawn from the study.